

The ecommerce metrics to track come down to a short list: revenue and orders, MER (blended ROAS), ad spend and CAC, new vs returning customers, and conversion rate. Watch a small set every day and review the rest weekly. Whichever ones you pick, they are only as good as your tracking, and most stores under-report.
Analytics tools hand you hundreds of numbers, and every ad platform reports its own version of the truth. Open four tabs and you still cannot answer the question you actually care about: is the store growing, and is the ad spend paying for itself? A short, trusted set of ecommerce KPIs answers that in under a minute.
What makes a metric worth tracking
A metric earns its place if it changes a decision. Revenue tells you whether the store is growing. MER tells you whether your marketing is efficient. CAC tells you whether you can afford to acquire another customer. If a number would not change what you do next, it belongs in a monthly report, not on your daily screen.
Keep the set small and mixed. Include outcome metrics like revenue and orders, and efficiency metrics like MER and CAC, so you see both how much you sold and what it cost to sell it. Then keep it short enough to read in under a minute. Someone who checks six numbers every morning spots a problem faster than someone who checks sixty once a week.
The ecommerce metrics that actually matter
These belong on almost every Shopify store's list, whatever you sell.
Revenue and orders
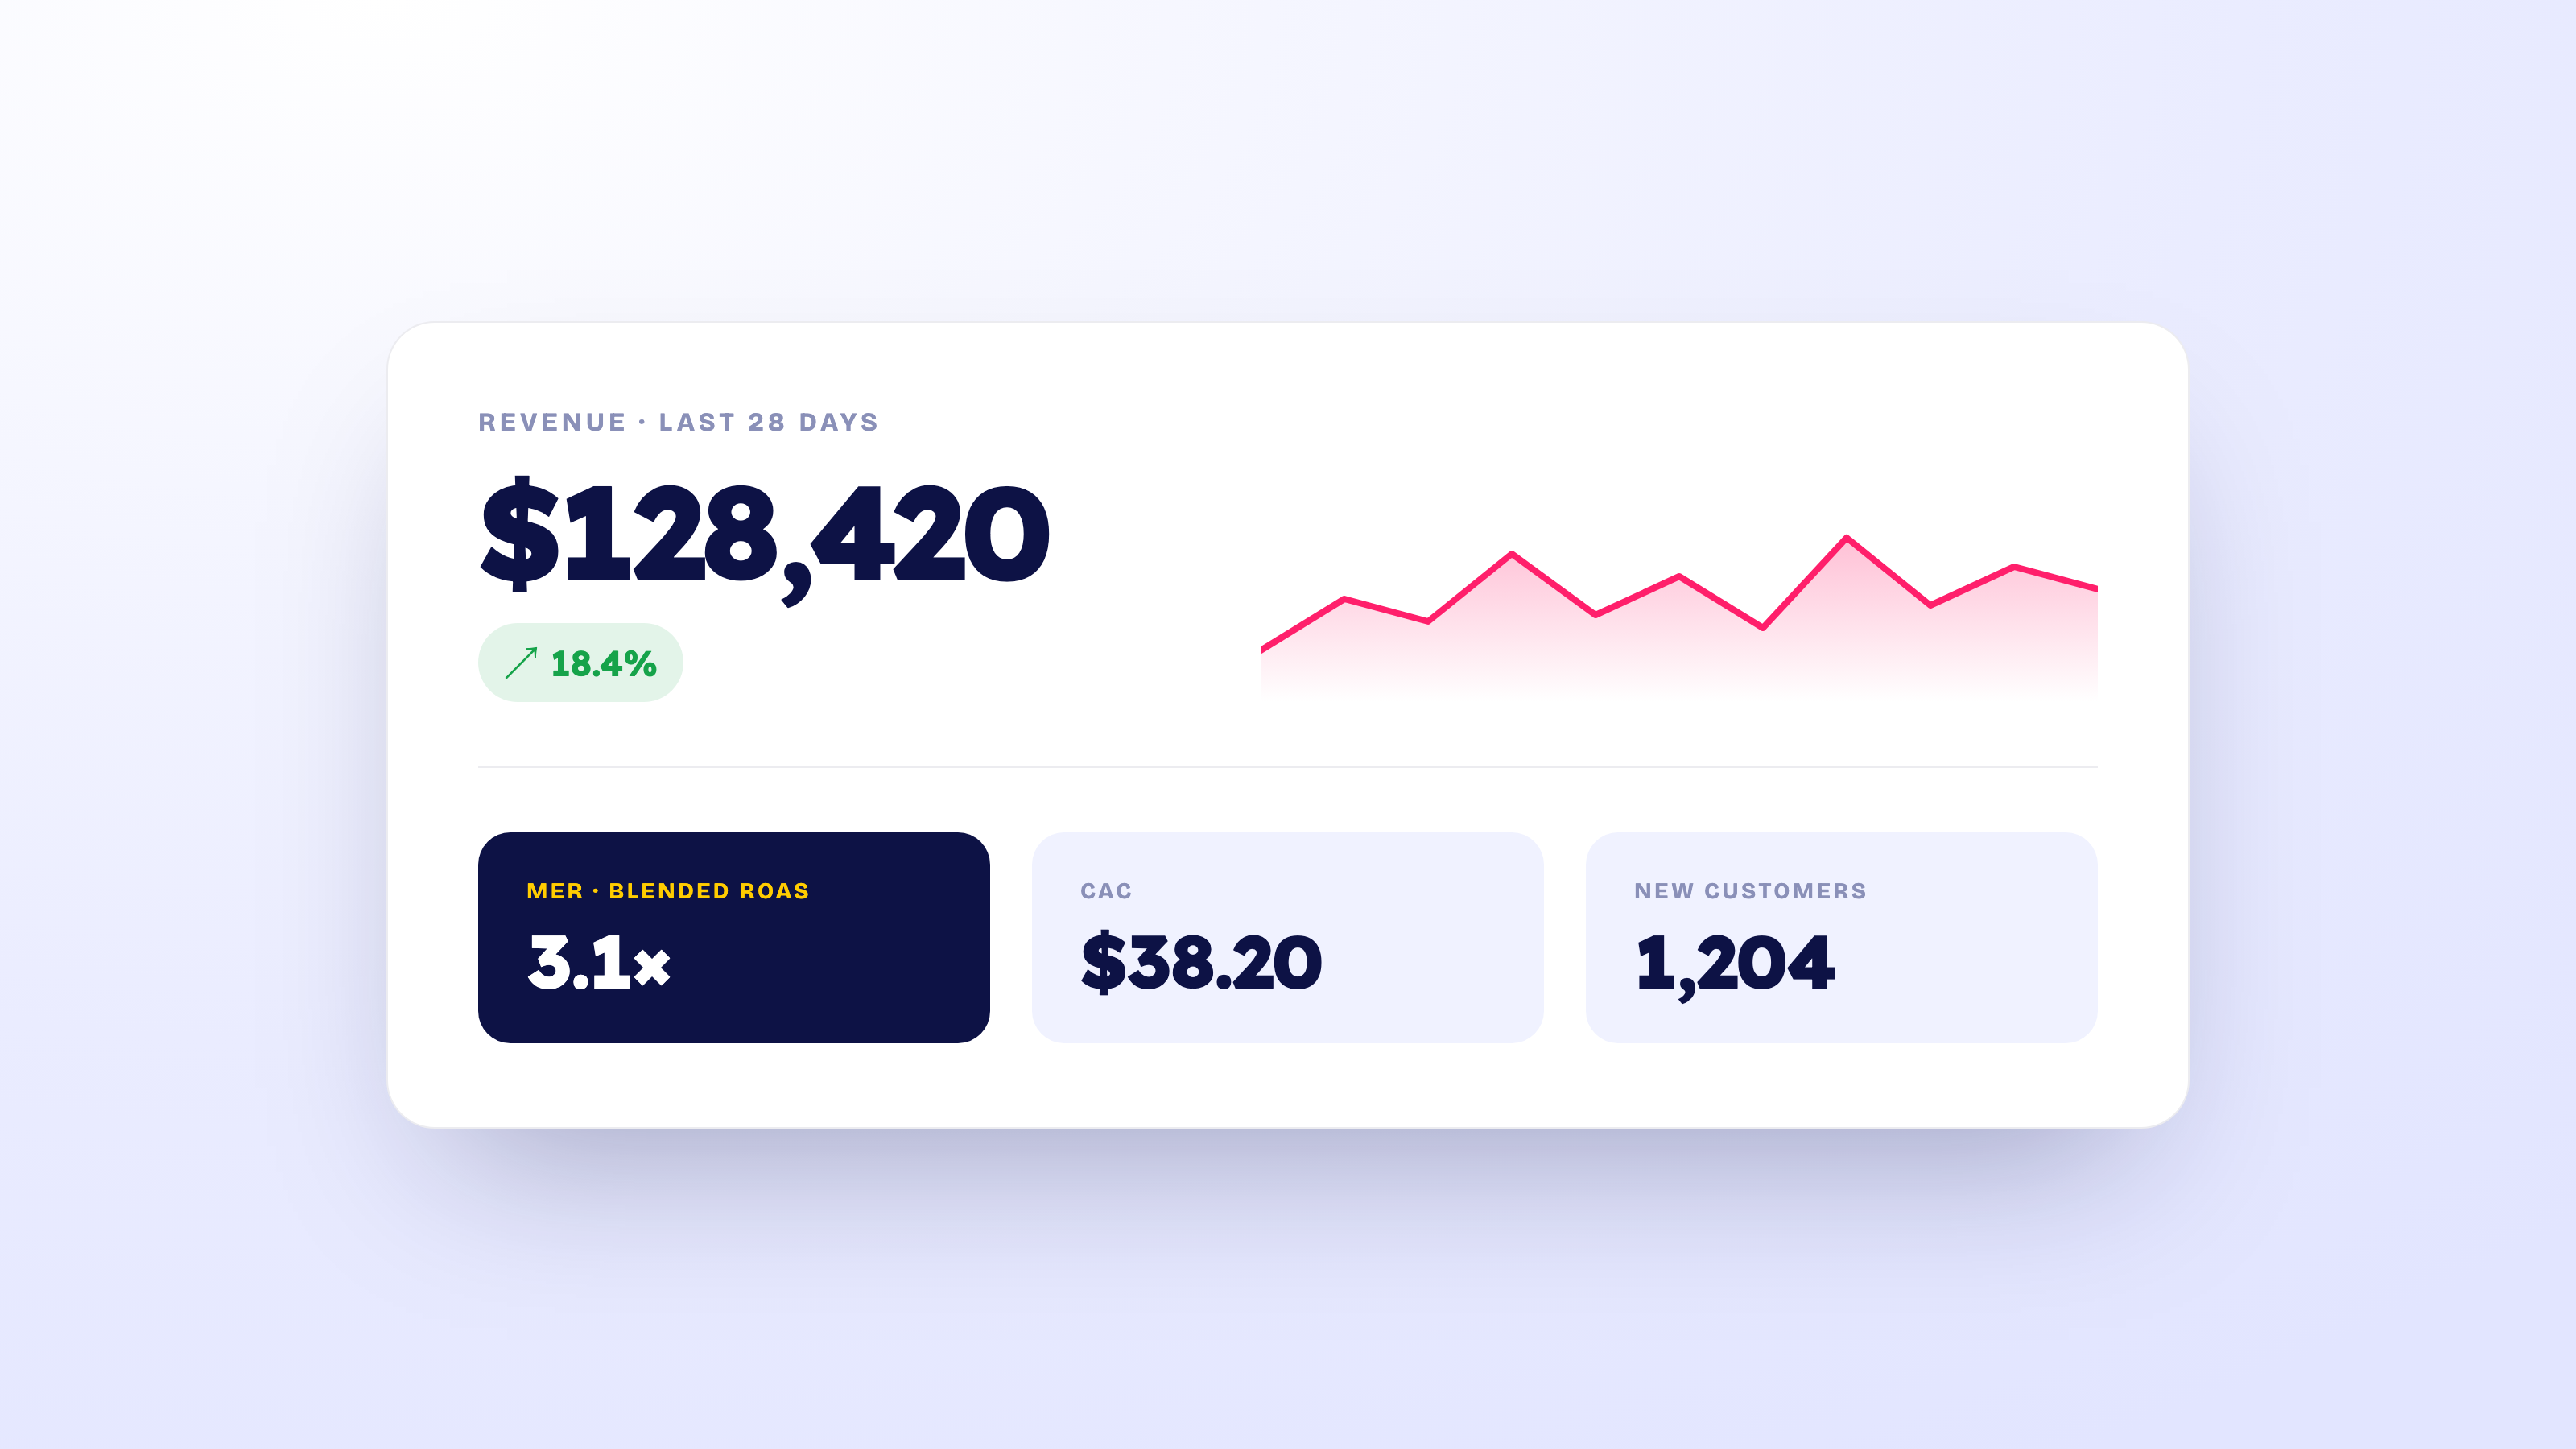
Revenue is the headline, orders are the context. Revenue on its own can mislead: a good day built on one large order is not the same as a good day built on fifty small ones. Track them together and watch the trend, not the single day. A rolling 7-day and 28-day view smooths out the noise of weekends and paydays.
MER (blended ROAS)
MER (blended ROAS) is your total revenue divided by your total ad spend across every channel. It ignores which ad gets the credit, so it sidesteps the per-platform reporting problem. Meta, Google, TikTok and Pinterest each claim the same sale, so their individual ROAS figures add up to more revenue than your store actually made. MER measures the business instead: for every dollar you put into ads, how many dollars come back in total.
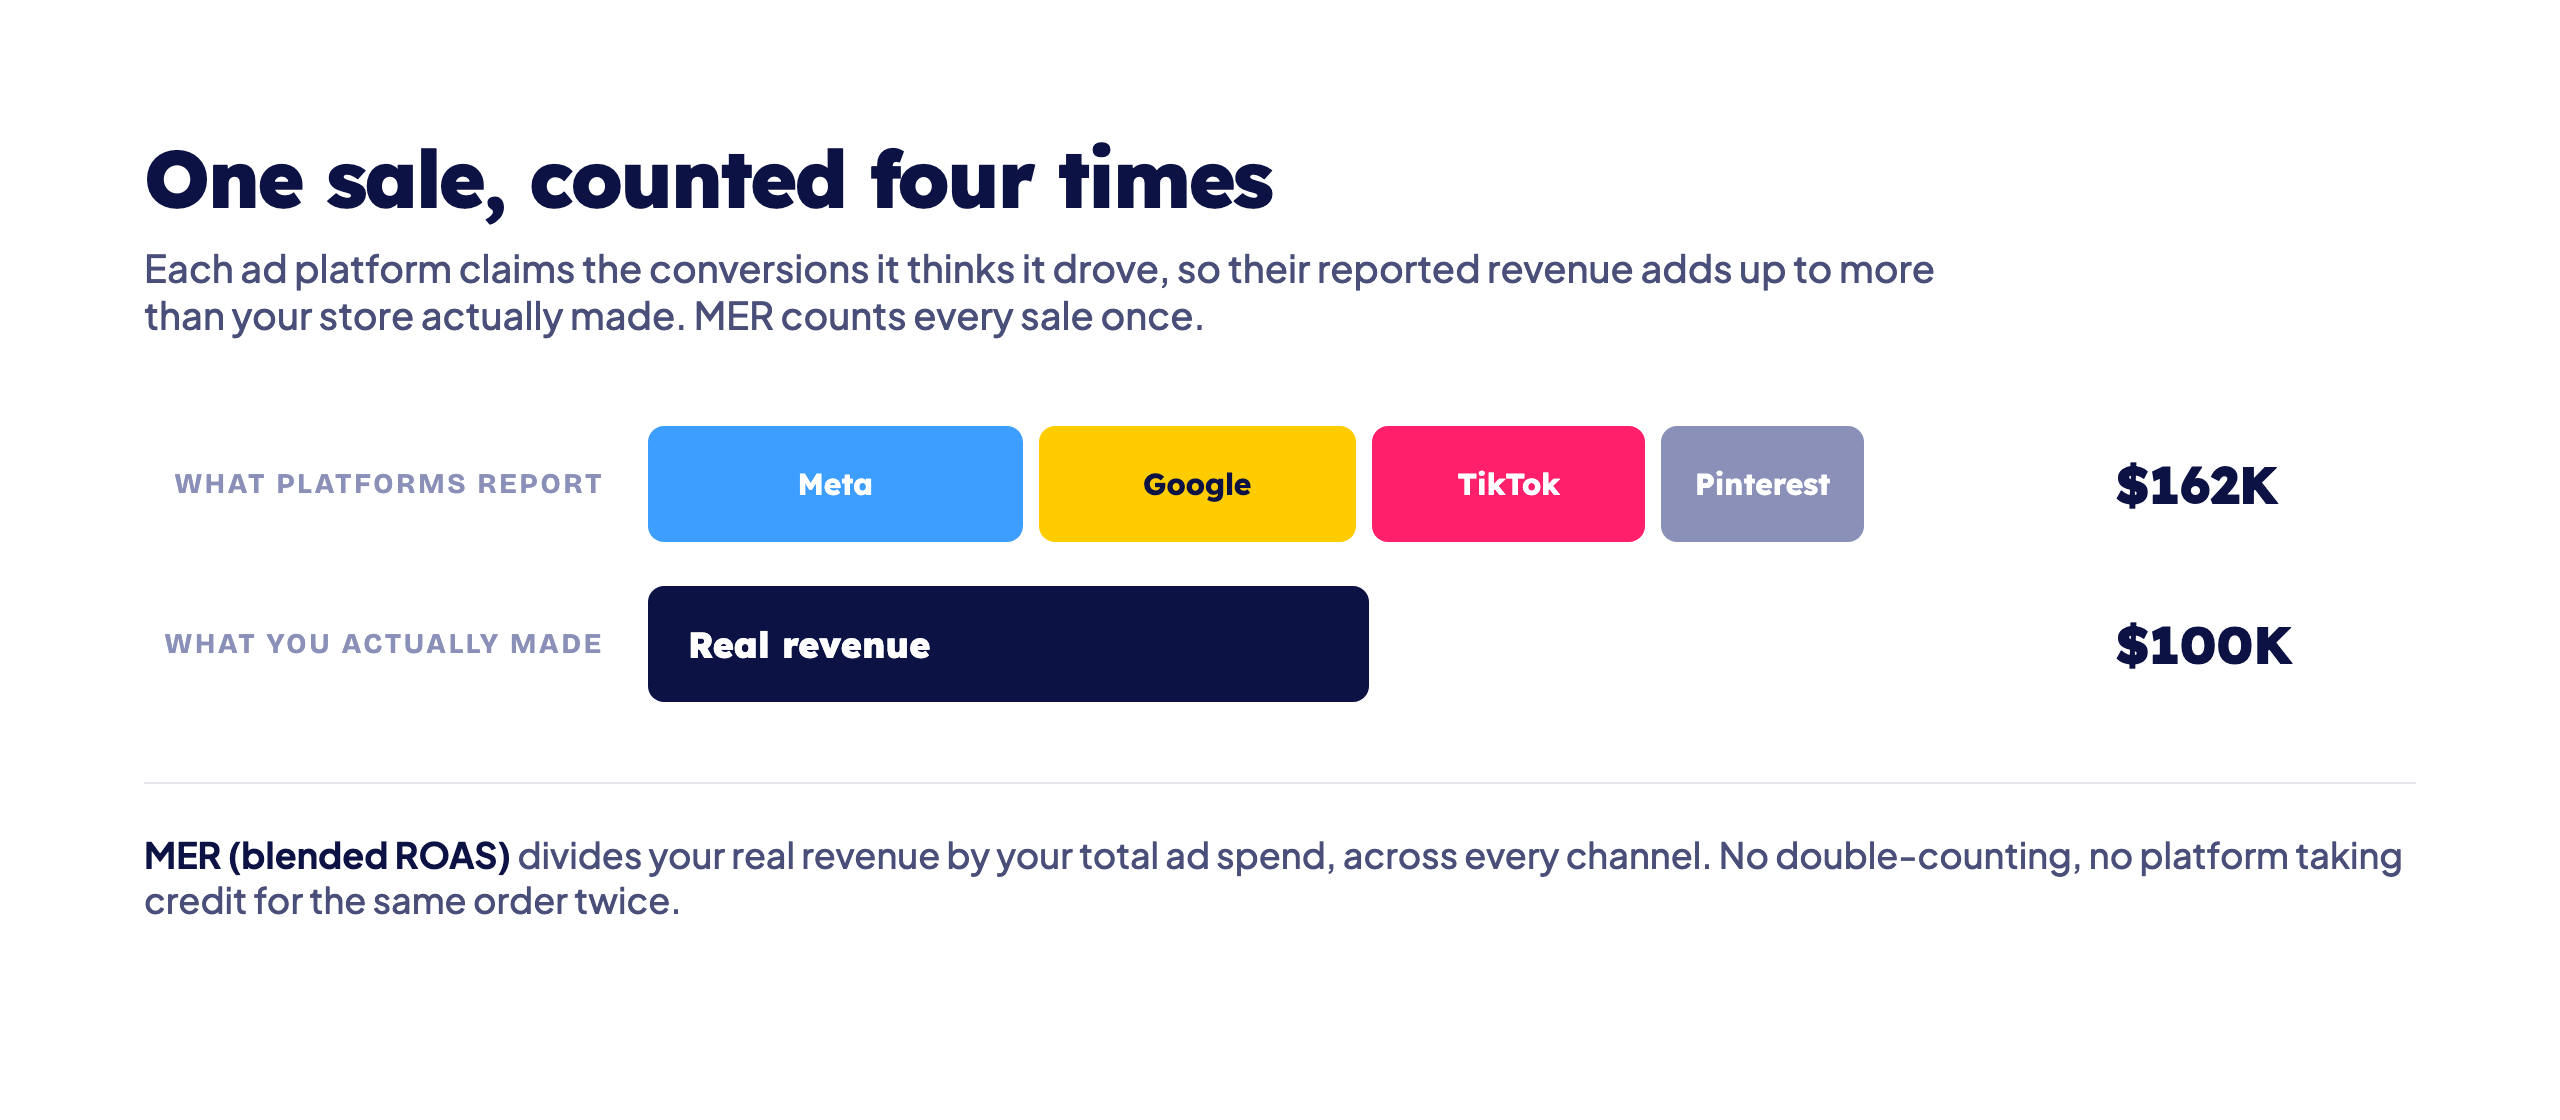
It is the efficiency number worth watching first.
Ad spend and CAC
Ad spend is what you put in, CAC (customer acquisition cost) is what it buys you. CAC is your acquisition spend divided by the number of new customers it produced. Rising CAC with flat revenue is an early warning that your ads are getting more expensive, well before it shows up in the bank. Watch CAC next to new-customer ROAS to see whether growth is still profitable or whether you are buying sales at a loss.
New vs returning customers
Blended totals can flatter you. A store can look healthy while new-customer acquisition stalls and repeat buyers carry the total. Splitting new vs returning shows which engine is really running. It also feeds better signals back to your ad platforms, so they optimise for first-time buyers instead of re-buying customers you already had.
Conversion rate and AOV
Conversion rate (orders divided by sessions) and average order value round out the picture. They are the levers behind revenue: you grow by sending more traffic, converting more of it, or making each order worth more. When revenue moves and you want to know why, these two usually hold the answer.
The metric problem no dashboard warns you about
Every number above is only as good as the data behind it, and for most Shopify stores that data has a hole in it.
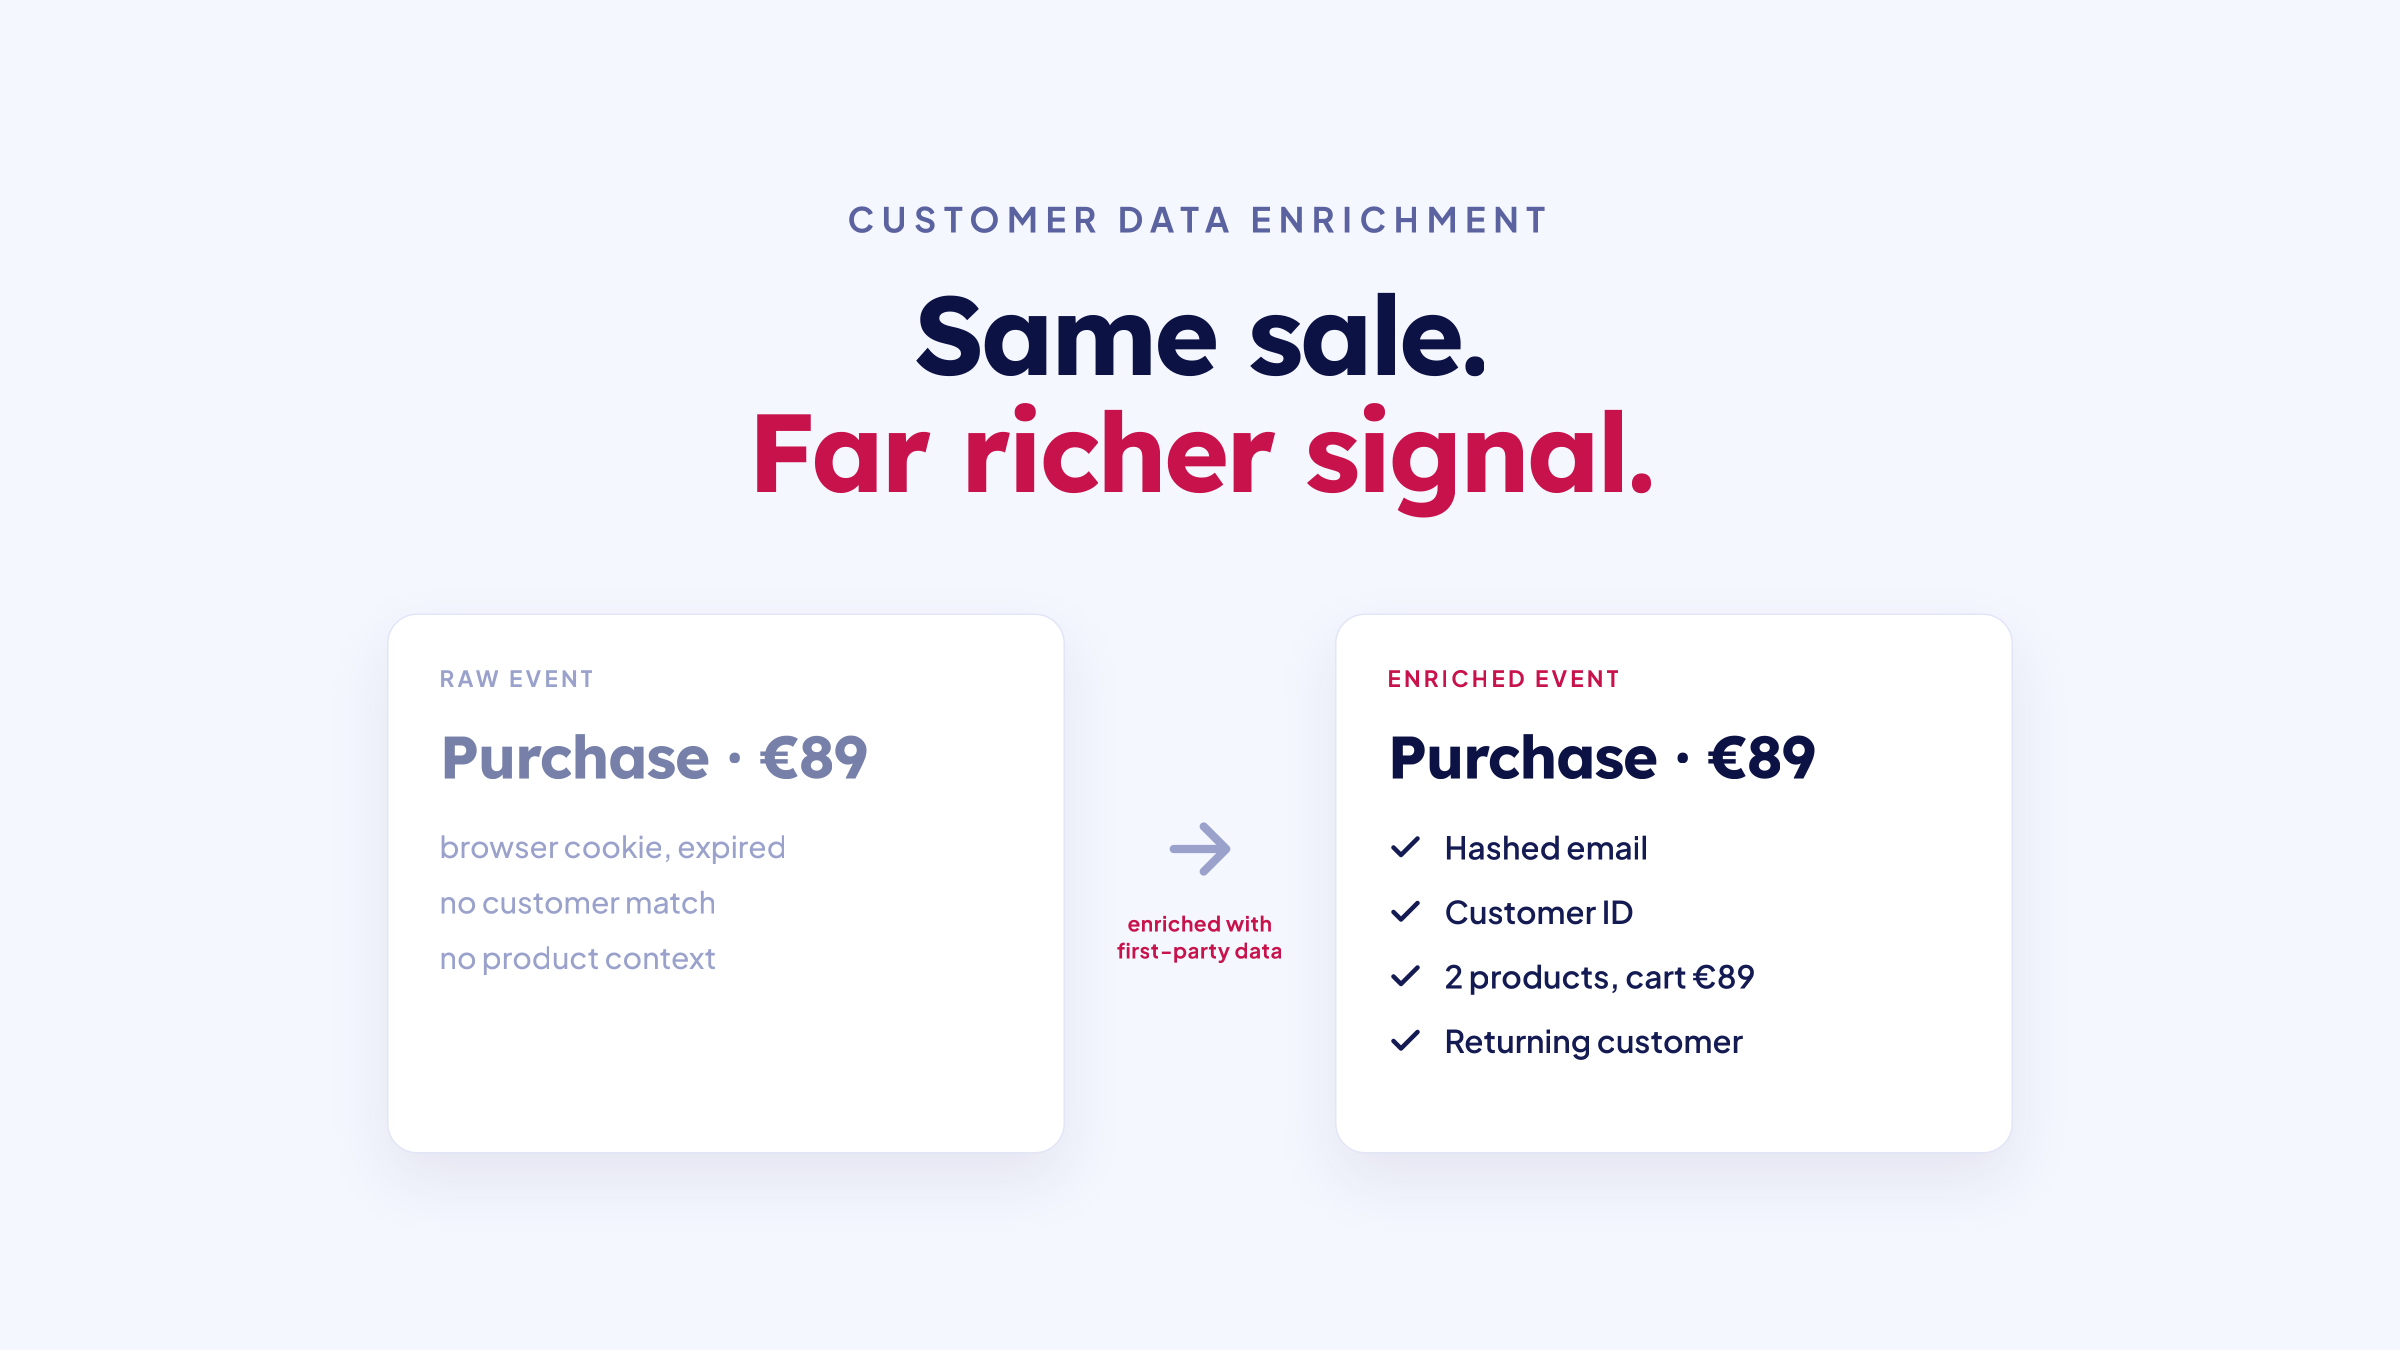
Browser pixels miss roughly 30 to 60 percent of conversions. Ad blockers, iOS privacy changes and consent banners all stop the pixel from firing, so a large share of real sales never reach your reports. Your conversion rate looks lower than it is, your CAC looks higher, and your ROAS looks worse than reality. Then you pause campaigns and cut budgets on numbers that are wrong, and wrong in the same direction every time.
Server-side tracking closes most of that gap. Instead of relying on the browser, it captures conversions on the server and enriches it with first-party data, then sends complete events to your ad and email platforms. Your metrics only mean something once the data behind them is complete. If your numbers never seem to match your ad platforms, this is usually why. We cover it in why your Shopify sales don't match your ad platforms and how much revenue you're losing to bad tracking.
How often should you check each metric
Not every metric needs daily attention. Check the slow ones too often and you turn normal daily variance into false alarms.
-
Daily: revenue and orders, MER (blended ROAS), ad spend, CAC. These catch a campaign that ran away with the budget or a checkout that broke overnight.
-
Weekly: new vs returning split, conversion rate, AOV, channel-level performance. Enough signal has built up to tell a real trend from noise.
-
Monthly: cohort and repeat-purchase behaviour, lifetime value, margin. These move slowly and reward a longer view.
Keep the daily set short. Five or six numbers, once a day, catches almost every problem while it is still small.
How to keep your daily numbers one glance away
Most people already know which numbers to check. They just do not want to open a laptop and stitch four dashboards together every morning to do it.
That is what we built TrackBee Mobile for. It puts your daily set, revenue, orders, MER (blended ROAS), ad spend, CAC and new-customer metrics, on your phone, already loaded when you open it. A home-screen widget keeps today's revenue and MER one glance away, and because TrackBee tracks server-side, the numbers include the conversions a browser pixel would have missed. Run more than one store? Switch between them or view them together.
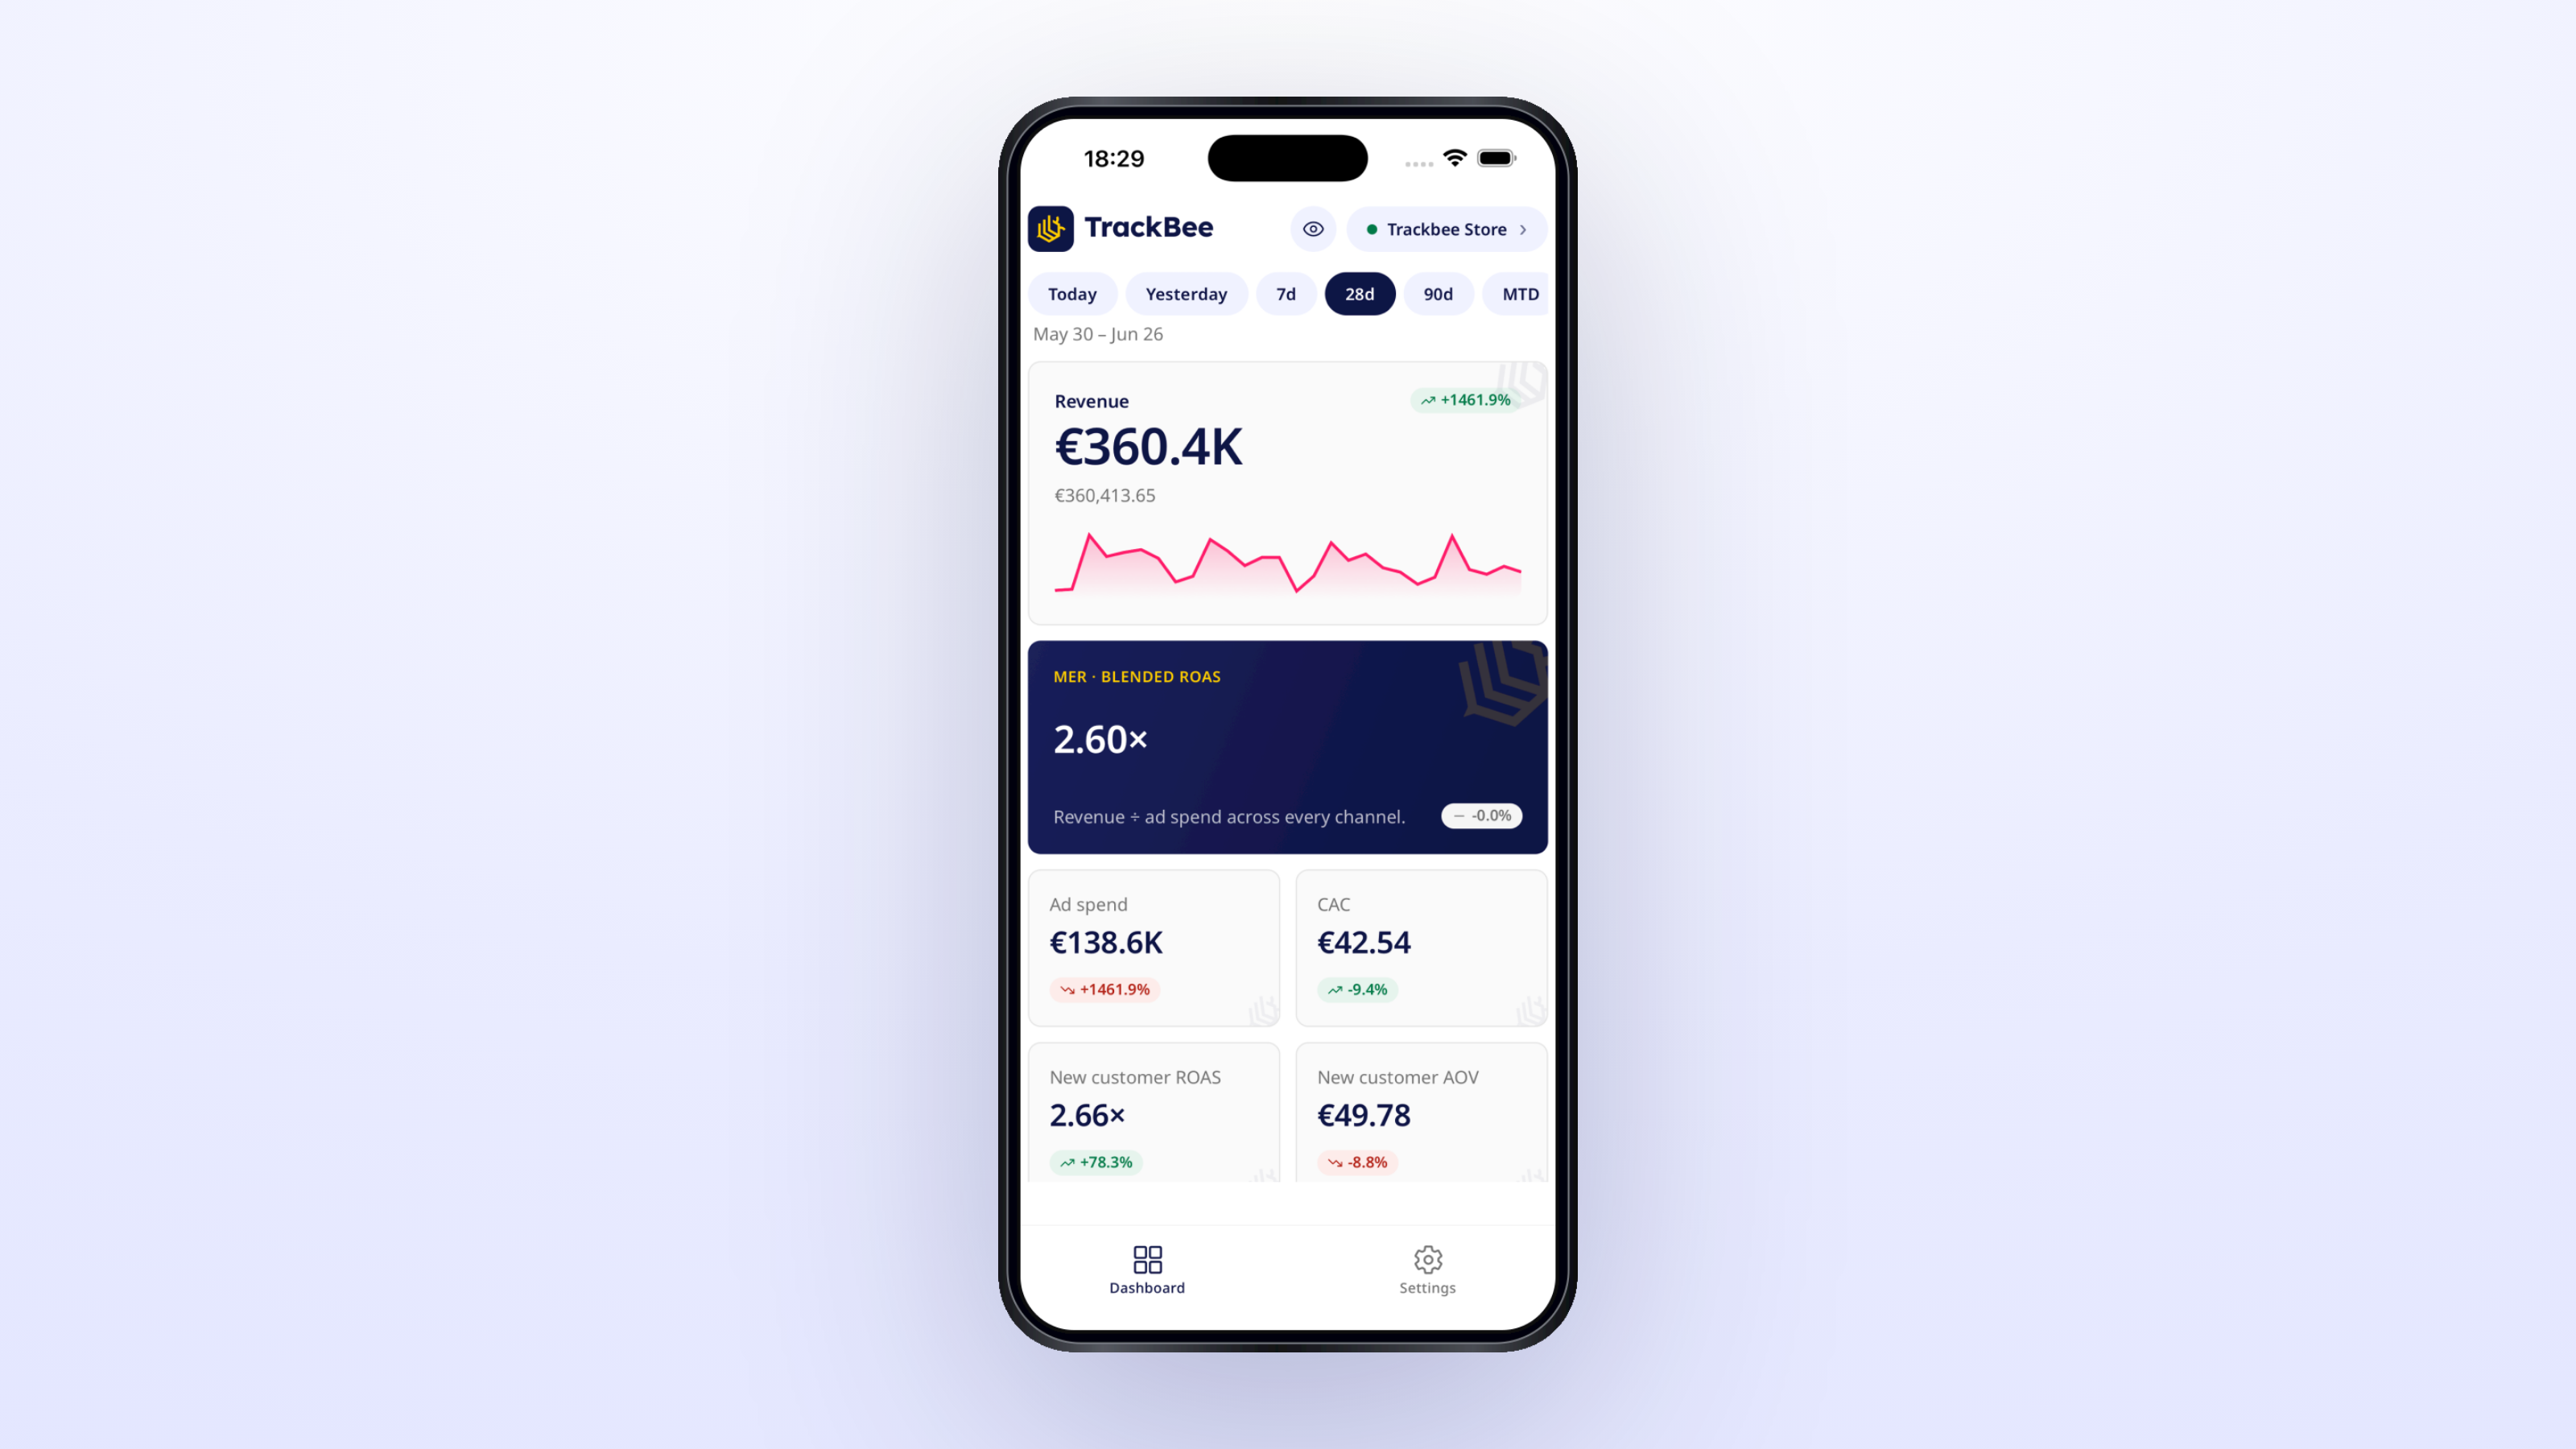
A thirty-second check you actually do beats a detailed report you open once a week. Spend the time acting on the numbers, not assembling them.
Frequently asked questions
What ecommerce metrics should I track daily? Revenue and orders, MER (blended ROAS), ad spend and CAC. That short set tells you whether the store is growing and whether your marketing is still efficient. Review conversion rate, AOV and the new vs returning split weekly.
What is MER, and how is it different from ROAS? MER (marketing efficiency ratio, also called blended ROAS) is total revenue divided by total ad spend across every channel. Per-platform ROAS counts each channel's claimed conversions, and platforms double-count the same sale, so MER is the more honest measure of whether your marketing pays for itself.
What is a good CAC? There is no universal number. A healthy CAC is one your margins and average order value can support while still leaving room for profit. Track it against new-customer ROAS and your contribution margin rather than against a benchmark from a different store.
Why don't my metrics match what my ad platforms report? Because browser pixels miss roughly 30 to 60 percent of conversions to ad blockers, iOS privacy and consent banners, and because each platform claims credit for the same sale. Server-side tracking gives every platform a complete, deduplicated set of events, which is what brings the numbers back in line.
Can I track these metrics on my phone? Yes. TrackBee Mobile shows your revenue, orders, MER (blended ROAS), ad spend and CAC on iOS and Android, included with your TrackBee subscription.
Want your real numbers, not the under-reported ones, in front of you every day? Try TrackBee for free or book a demo.


.png)