Short answer: Before you panic, check whether your actual orders dropped by the same percentage. If orders held steady while reported conversion rate fell, you have a tracking problem, not a conversion problem. Inflated session counts or lost order events distort the ratio. Server-side tracking restores the events browsers miss so your rate reflects reality.
You open your dashboard on Monday morning and your conversion rate has tanked. Down 30%, maybe 40%, seemingly overnight. Nothing changed in your ads. No site redesign. No price increase. Just a cliff.
The instinct is immediate: something is broken. You start questioning your creatives, your landing pages, your audience targeting. Maybe you pause campaigns. Maybe you call an emergency team meeting.
But before you do any of that, ask yourself one question: did your actual orders drop by the same percentage?
If orders stayed roughly the same while your reported conversion rate plummeted, you don't have a conversion problem. You have a tracking problem. And the difference between those two things is worth thousands in wasted ad spend, unnecessary panic, and misguided decisions.
The Phantom Drop: When Metrics Lie
Here is the math that most store owners skip when they see a CVR decline.
Conversion rate = Orders / Sessions.
If your conversion rate drops, one of two things happened: either orders went down (a real problem), or reported sessions went up without corresponding orders (often a tracking anomaly), or sessions are being undercounted and orders appear to drop relative to inflated previous session counts.
But there is a third, more common scenario that almost nobody considers: your tracking stopped counting sessions and conversions accurately. Not because traffic changed, but because the measurement tool broke.
Shopify's native analytics is consent-gated. It misses roughly 40% of sessions depending on your market and consent banner setup. Google Analytics has the same dependency. When something shifts in how consent is collected, or how your pixel fires, or how iOS handles tracking, the numbers change even though nothing real changed in your business.
This is the phantom drop. It looks alarming in every dashboard. But it is a measurement artifact, not a business problem.
Five Causes of Phantom Conversion Rate Drops
After working with thousands of Shopify stores, we see the same five tracking failures causing artificial CVR swings over and over. Each one creates a gap between what actually happened on your store and what your dashboards report.
1. Consent Banner Change
This is the most common and least suspected cause.
You install a new consent management platform. Or your existing CMP pushes an update. Or you tweak the banner design, changing button colors or layout. Suddenly your consent acceptance rate shifts from 70% to 50%.
That 20-point drop in consent rate means your analytics tools now see 20% fewer sessions and conversions. Your actual traffic and sales are unchanged, but your dashboards show a sudden CVR decline because the denominator (tracked sessions) and numerator (tracked conversions) both shifted, often at different rates.
How to check: Compare your consent acceptance rate before and after the drop. Most CMPs have this in their dashboard. Also compare Shopify's order count (which is not consent-dependent) against your GA4 or ad platform conversion counts.
How to fix: If consent rates dropped due to a banner redesign, consider adjusting the UX. More importantly, recognize that consent-dependent tracking will always have this vulnerability. Google Consent Mode V2 helps Google model the gap, but it does not eliminate it.
2. iOS Update
Every major iOS release changes something about how Safari handles cookies, redirects, or click identifiers. iOS 14 was the earthquake. iOS 17 tightened link tracking protection further. Each update strips more signal from browser-side tracking.
The pattern is predictable: Apple pushes an update, adoption ramps over 2-3 weeks, and tracking coverage gradually erodes. Your CVR does not drop overnight with iOS updates. It slides over days, which makes it harder to diagnose because there is no single moment to point to.
How to check: Look at your device breakdown in GA4 or Shopify analytics. If the CVR drop is concentrated on iOS/Safari users, it is almost certainly a tracking issue, not a conversion issue.
How to fix: Browser-side pixels cannot fully solve this. Server-side tracking captures events independently of the browser, which is why it does not degrade with each iOS release. Learn more about server-side tracking for Shopify.
3. Tracking App Conflict
You install a new Shopify app. Maybe a currency converter, a sticky add-to-cart bar, or a bundle upsell tool. It seems unrelated to tracking. But behind the scenes it modifies the DOM, overrides event listeners, or injects scripts that interfere with your pixel.
Apps like "Ultimate Sticky Add to Cart" and "Kaching Bundle" have been documented to break AddToCart event tracking on Shopify stores. The cart still works for the customer, but the tracking event never fires. Your pixel stops seeing add-to-cart and sometimes checkout events, and your reported funnel collapses.
How to check: Correlate the CVR drop with your Shopify app install timeline. Open your browser console (right-click, Inspect, Console tab) and look for JavaScript errors on product and cart pages. Test the full funnel yourself: view a product, add to cart, begin checkout, and check if events appear in your ad platform's event manager.
How to fix: Temporarily disable recently installed apps one by one and monitor whether events return. If you find the culprit, contact the app developer or find an alternative. For a deeper dive, see our guide on fixing underreported conversions.
4. App Embed Turned Off
This is the trap that catches even experienced Shopify operators.
You update your theme, or switch themes, or a developer makes customizations. During the process, the App Embed toggle for your tracking tool gets turned off. It is a small switch buried inside Shopify's theme editor under Online Store > Customize > App Embeds.
When the App Embed is off, no client-side events fire. No page views, no product views, no add-to-cart events, no click ID capture. Your pixel goes completely silent without any error message or warning. Your store keeps working perfectly for customers, so you have no reason to suspect anything until you look at your dashboards days later.
How to check: Go to Shopify > Online Store > Customize > App Embeds and verify your tracking app is toggled on. You can also right-click on your store, open the browser console, and search for your tracking script. If it is missing, the embed is off.
How to fix: Toggle it back on. It takes five seconds. But the damage from days or weeks of missing data cannot be recovered retroactively in most platforms. This is why regular tracking health checks matter.
5. Pixel Removed or Modified
Someone on your team removes a "duplicate" pixel, not realizing it was your primary conversion tracking pixel. Or a Shopify app update modifies your pixel configuration. Or you revoke an access token while cleaning up app permissions.
This is more common with multi-person teams and agencies where multiple people have access to the Shopify backend and ad platform settings.
How to check: Go to your ad platform's event manager (Meta Events Manager, Google Tag Assistant, TikTok Events Manager) and verify that events are still being received. Look for gaps in the event timeline. If events stopped on a specific date, cross-reference that with any changes made in Shopify or the ad platform.
How to fix: Reconnect the pixel or restore the access token. For Meta, check if your Conversions API access token is still valid. For stores running multiple tracking solutions, run a duplicate tracking detection scan to make sure you are not over- or under-counting.
The Diagnostic Framework: Real Drop vs. Phantom Drop
Before you react to a CVR decline, run through this decision tree:
Step 1: Check your actual orders.
Go to Shopify > Orders. Filter by the time period where your CVR dropped. Did order volume actually decline? If orders are stable or growing, the CVR drop is almost certainly a measurement issue.
Step 2: Check your revenue.
Same logic. If revenue held steady but your analytics platform shows fewer conversions, the platform is undercounting, not your store underperforming.
Step 3: Compare across sources.
Look at Shopify orders, GA4 conversions, and ad platform conversions side by side. If only one source shows the drop, the problem is isolated to that source's tracking, not your actual performance. When Shopify sales don't match your ad platform, tracking is usually the culprit.
Step 4: Check the timing.
Did the drop happen on a specific date? Correlate it with theme changes, app installs, consent banner updates, or iOS release dates. Phantom drops almost always align with a trackable event.
Step 5: Check device/browser segments.
If the drop is isolated to Safari/iOS users, it is a tracking issue. If it is uniform across all devices and browsers, it is more likely a real conversion issue worth investigating.
If you pass through all five steps and determine the drop is real, then absolutely investigate your ads, landing pages, pricing, and user experience. Real CVR drops happen - and our guide to Shopify CRO tactics covers 10 high-impact improvements you can test. But the point is: diagnose first, react second.
Why Consent Rate Changes Create the Biggest Artificial Swings
Of all five phantom causes, consent banner changes deserve extra attention because they are the most deceptive.
Here is why. When your consent rate drops, both your session tracking and your conversion tracking degrade. But they rarely degrade at the same rate. Session tracking often degrades more because pageview events fire first (and get blocked), while purchase events might still partially fire through server-side fallbacks or Shopify's own order webhooks.
The result is a mathematically paradoxical situation: you can see your reported CVR go UP even though your total tracked volume went DOWN. Or vice versa. The numbers become unreliable in both directions.
This is why relying on consent-dependent tracking as your single source of truth is fundamentally fragile. Every CMP update, every A/B test on banner design, every regulatory change in consent requirements creates a data discontinuity that makes week-over-week comparison meaningless.
The solution is a tracking layer that does not depend entirely on consent-gated browser events. Server-side tracking captures conversions at the server level, giving you a stable baseline that does not swing every time your consent rate moves.
How Server-Side Tracking Gives You a Stable Baseline
The root cause of phantom drops is over-reliance on consent-gated, browser-dependent tracking. Server-side tracking solves this by capturing events at the server level, independent of the browser environment.
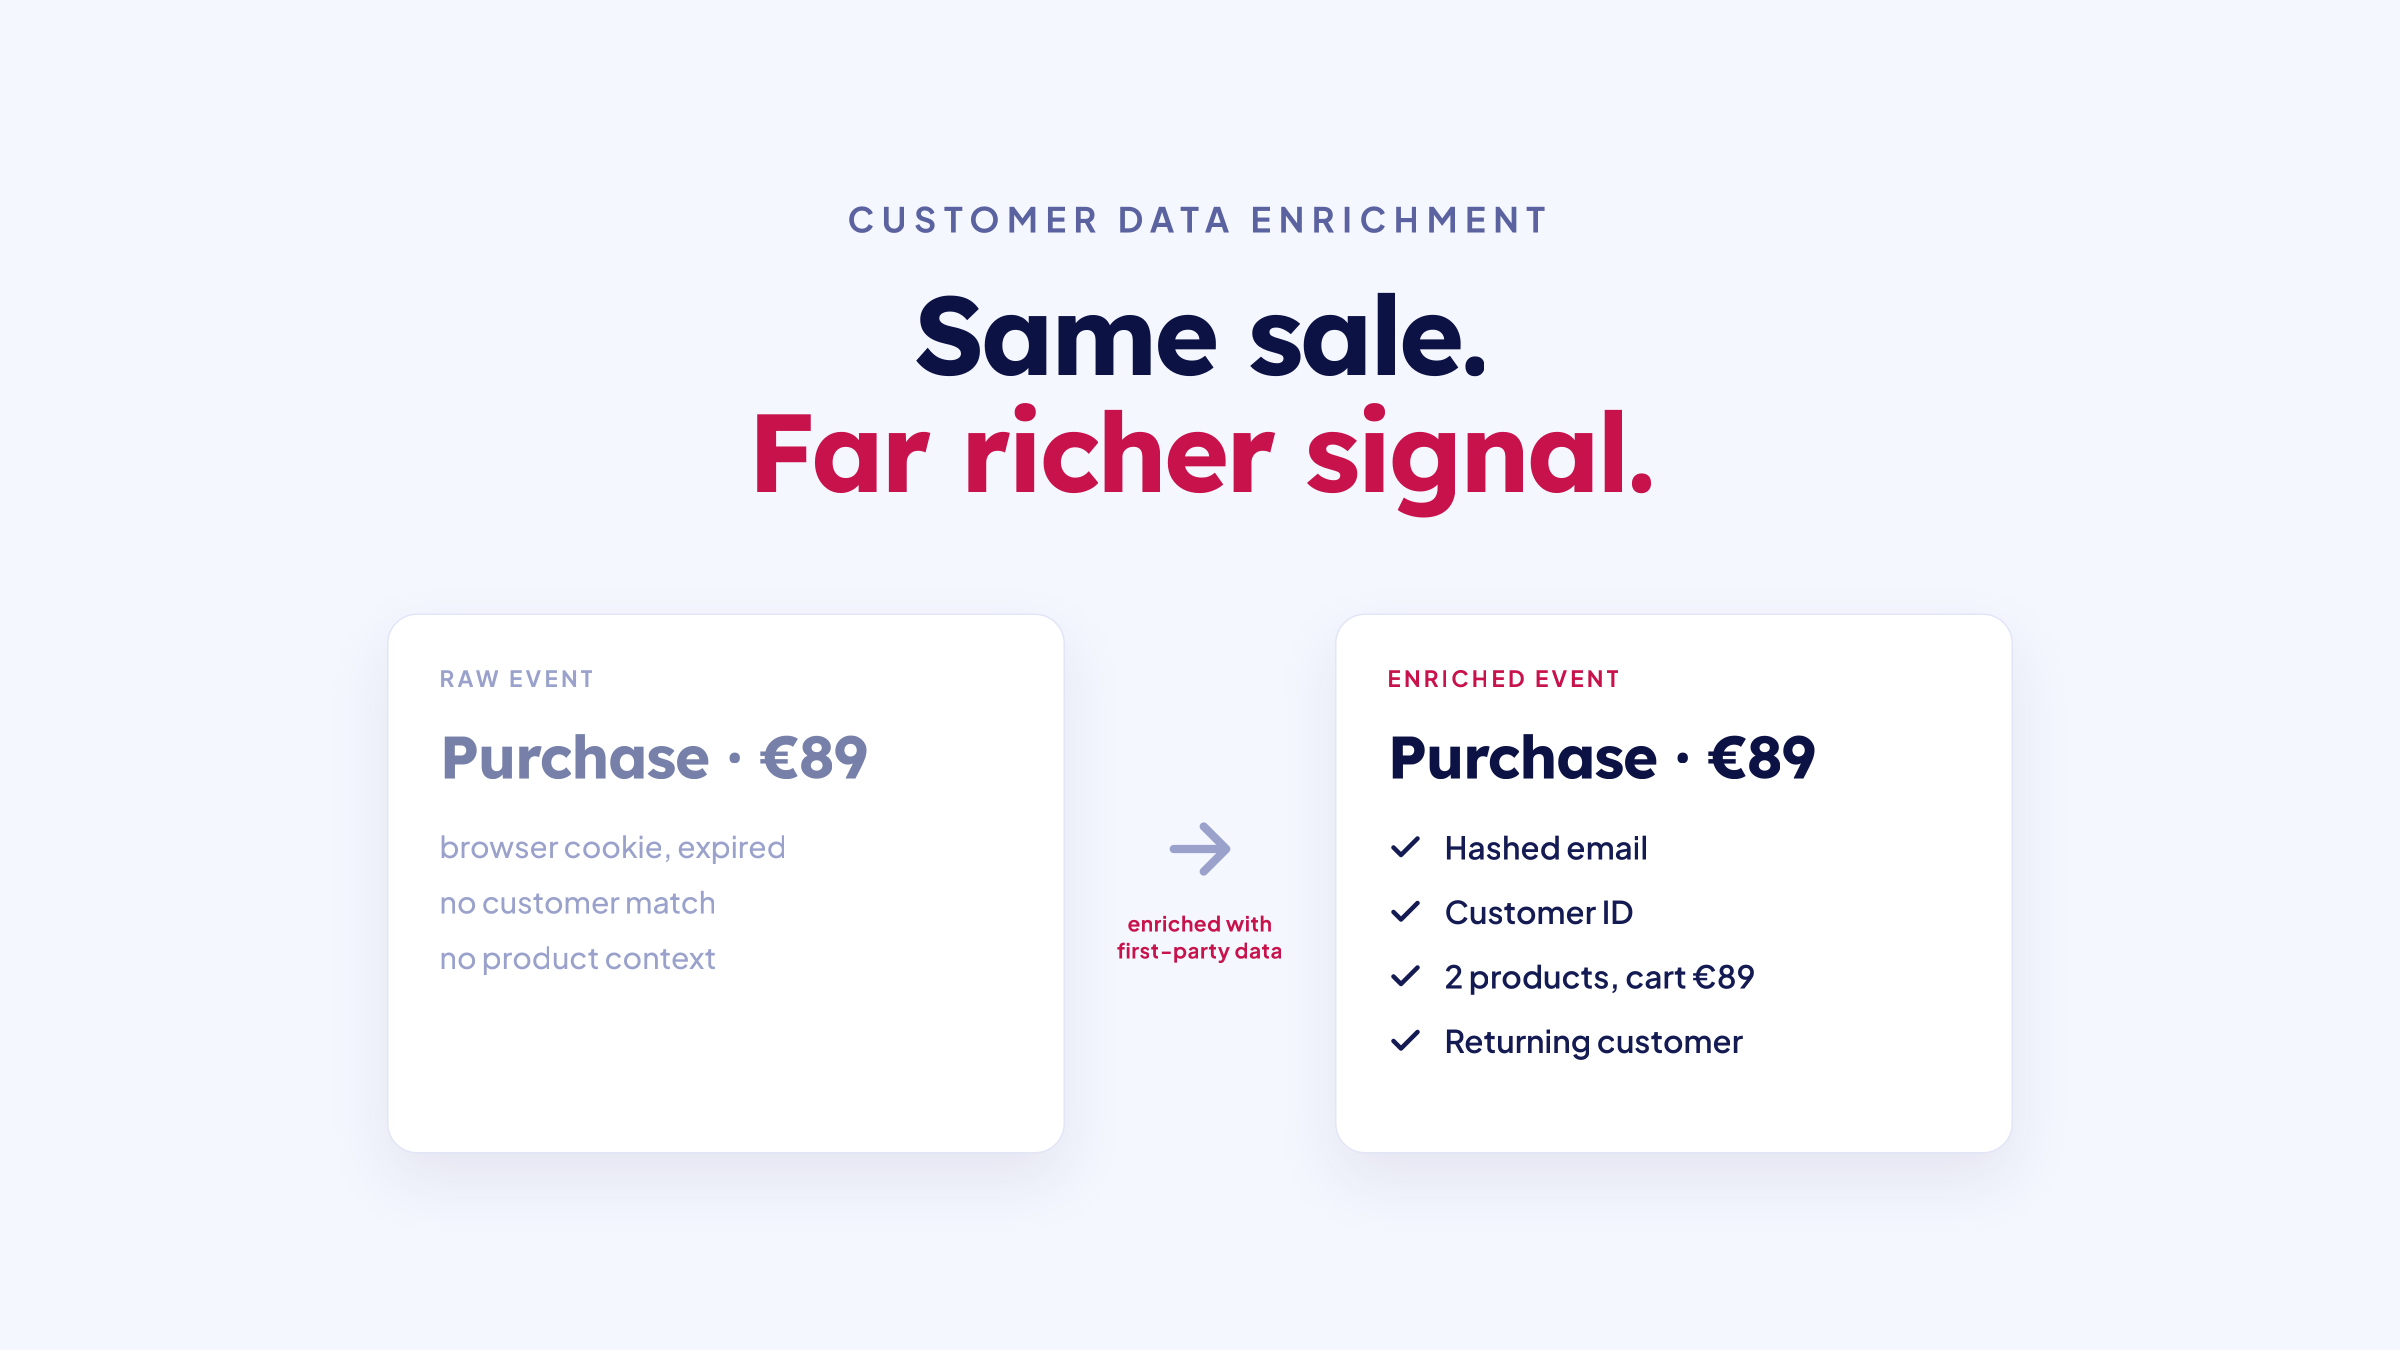
When a customer completes a purchase, the order is recorded on Shopify's servers regardless of consent status, ad blockers, or iOS restrictions. Server-side tracking captures that order event directly, then sends it to your ad platforms and analytics tools with the enriched data they need to attribute it correctly.
This gives you a stable, consistent baseline. Your conversion count does not swing every time a consent banner changes or an iOS update rolls out, because the server-side capture is not subject to those browser-level disruptions. You get a measurement layer that reflects what actually happened on your store, not what survived the gauntlet of browser restrictions.
For the full explanation of how this works and how to set it up, see what is server-side tracking and how to install it for Shopify.
Frequently Asked Questions
My conversion rate dropped overnight. How do I know if it's real?
Check your actual Shopify order count for the same period. If orders held steady while your reported conversion rate fell, it is a tracking problem, not a conversion problem.
Can a consent banner really change my conversion rate?
Yes. A consent banner change shifts how many sessions and conversions your analytics tools can track. A drop in consent acceptance rate directly reduces tracked volume, which distorts your reported conversion rate even though real behavior is unchanged.
Why did my conversion rate drop after an iOS update?
iOS updates tighten browser privacy and strip click identifiers. This reduces the conversions your browser-based pixels can capture and attribute. The orders still happen, but your tracking sees fewer of them.
How do I check if my Shopify tracking is broken?
Compare Shopify order count against GA4 and ad platform conversions for the same window. Check that your tracking app embed is enabled. Test the full funnel yourself and confirm events appear in your ad platforms' event managers.
Does server-side tracking fix phantom conversion rate drops?
It gives you a stable baseline that does not swing with consent rates or iOS updates. Server-side tracking captures conversions at the server level, so your measurement reflects actual orders rather than only the events that survive browser restrictions.


.png)