

Short answer: Every week each campaign gets one of three calls: scale, cut, or watch. Scale the ones comfortably above your break-even ROAS with a stable or rising trend and room to grow. Cut the ones below break-even that have had a fair run. Watch the rest, the ones near the line or still learning. The trick is deciding on your true, server-side numbers, not the incomplete ones your pixel reports. The fastest way to get the call for every campaign at once is the /analyze-ad-performance prompt in TrackBee Insights.
Most weeks the hard part is not knowing the metrics, it is deciding what to do with them. You have twenty or forty ad sets, each with its own ROAS, spend, and trend, and no clean way to say which ones deserve more budget, which are quietly wasting it, and which just need another week. This guide gives you a simple framework for that call, and the fast way to run it across your whole account.
Do it in one prompt instead
Connect TrackBee Insights to Claude or ChatGPT and get a scale, cut, or watch call for every campaign, on your real server-side data:
/analyze-ad-performance Try TrackBee Insights free →
The weekly job: scale, cut, or watch
Every active campaign lands in one of three buckets each week. Scale means it is winning and can take more budget. Cut means it is losing money and the budget belongs elsewhere. Watch means the signal is not clear enough to act on yet, so you leave it and look again next week.
The whole job is sorting your campaigns into those three buckets honestly. Do that every week and your budget drifts toward what works. Skip it, and spend quietly piles up on the ads that stopped earning.
How to read each campaign
Read every campaign against your break-even ROAS, the point where an ad just pays for itself, roughly 1 divided by your gross margin. Then look at the trend and the room to grow, not just today's number.
| Call | What it looks like | What to do |
|---|---|---|
| Scale | Comfortably above break-even, stable or rising, frequency still low, reaching new people | Add budget in steps of 20 to 30 percent, not all at once |
| Watch | Near break-even, or recently changed and still in learning, or a mixed signal | Leave it alone and check again next week |
| Cut | Below break-even after a fair run, flat or falling, real spend adding up | Turn it off and move the budget to a scaler |
Two rules keep this honest. Give a campaign enough spend and time before you judge it, so you are not cutting on noise. And move budget gradually, since a big jump resets the learning and can undo the very performance you were scaling.
The manual way, and why it is slow
You can do this by hand. Open Meta Ads Manager and Google Ads, pull ROAS, spend, CPA, and frequency for every campaign, drop them into a spreadsheet, work out your break-even, and mark each one scale, cut, or watch. Then reconcile the platforms against Shopify because the totals never match, and repeat the whole thing next week.
It works, but across two platforms and forty ad sets it eats the best part of a morning, and the numbers you are sorting on are only the conversions the pixel caught. Which is the part that quietly breaks the decision.
The catch: decide on real numbers, not pixel numbers
The scale, cut, or watch call is only as good as the ROAS under it, and platform ROAS is built on the conversions the browser pixel managed to record. Browser pixels miss a large share of sales, commonly estimated at 30 to 60 percent, between ad blockers (around 30 percent of internet users run one, GWI via DataReportal), iOS privacy (only about half of users opt in to tracking, AppsFlyer), and consent banners.
So a campaign can look like a cut when it is really a scaler whose sales went uncounted. Deciding on incomplete numbers means scaling the wrong winners and cutting real ones. Before you act, make sure the ROAS reflects real sales: confirm your tracking is working, and remember that a dip can be under-reporting rather than a fatigued creative. Set your bar with your true break-even, the same way you would read performance by country.
The one-line version: ask TrackBee Insights
Instead of building that spreadsheet every week, you can ask for the calls. TrackBee Insights connects your TrackBee data to Claude or ChatGPT, so you ask in plain language and get an answer from your real, server-side sales across Meta and Google. To get the weekly read, you type one prompt:
/analyze-ad-performance
It reads every active campaign on Meta and Google, scores each against your break-even, and gives a clear scale, cut, or watch verdict with the reason behind it: how much to scale, which ads are bleeding and why, and which to leave for another week. It even flags the funnel mismatches, the ads that pull attention up top but do not convert. Run it every week and the weekly review stops being a morning in a spreadsheet.
Decide on sales that actually happened
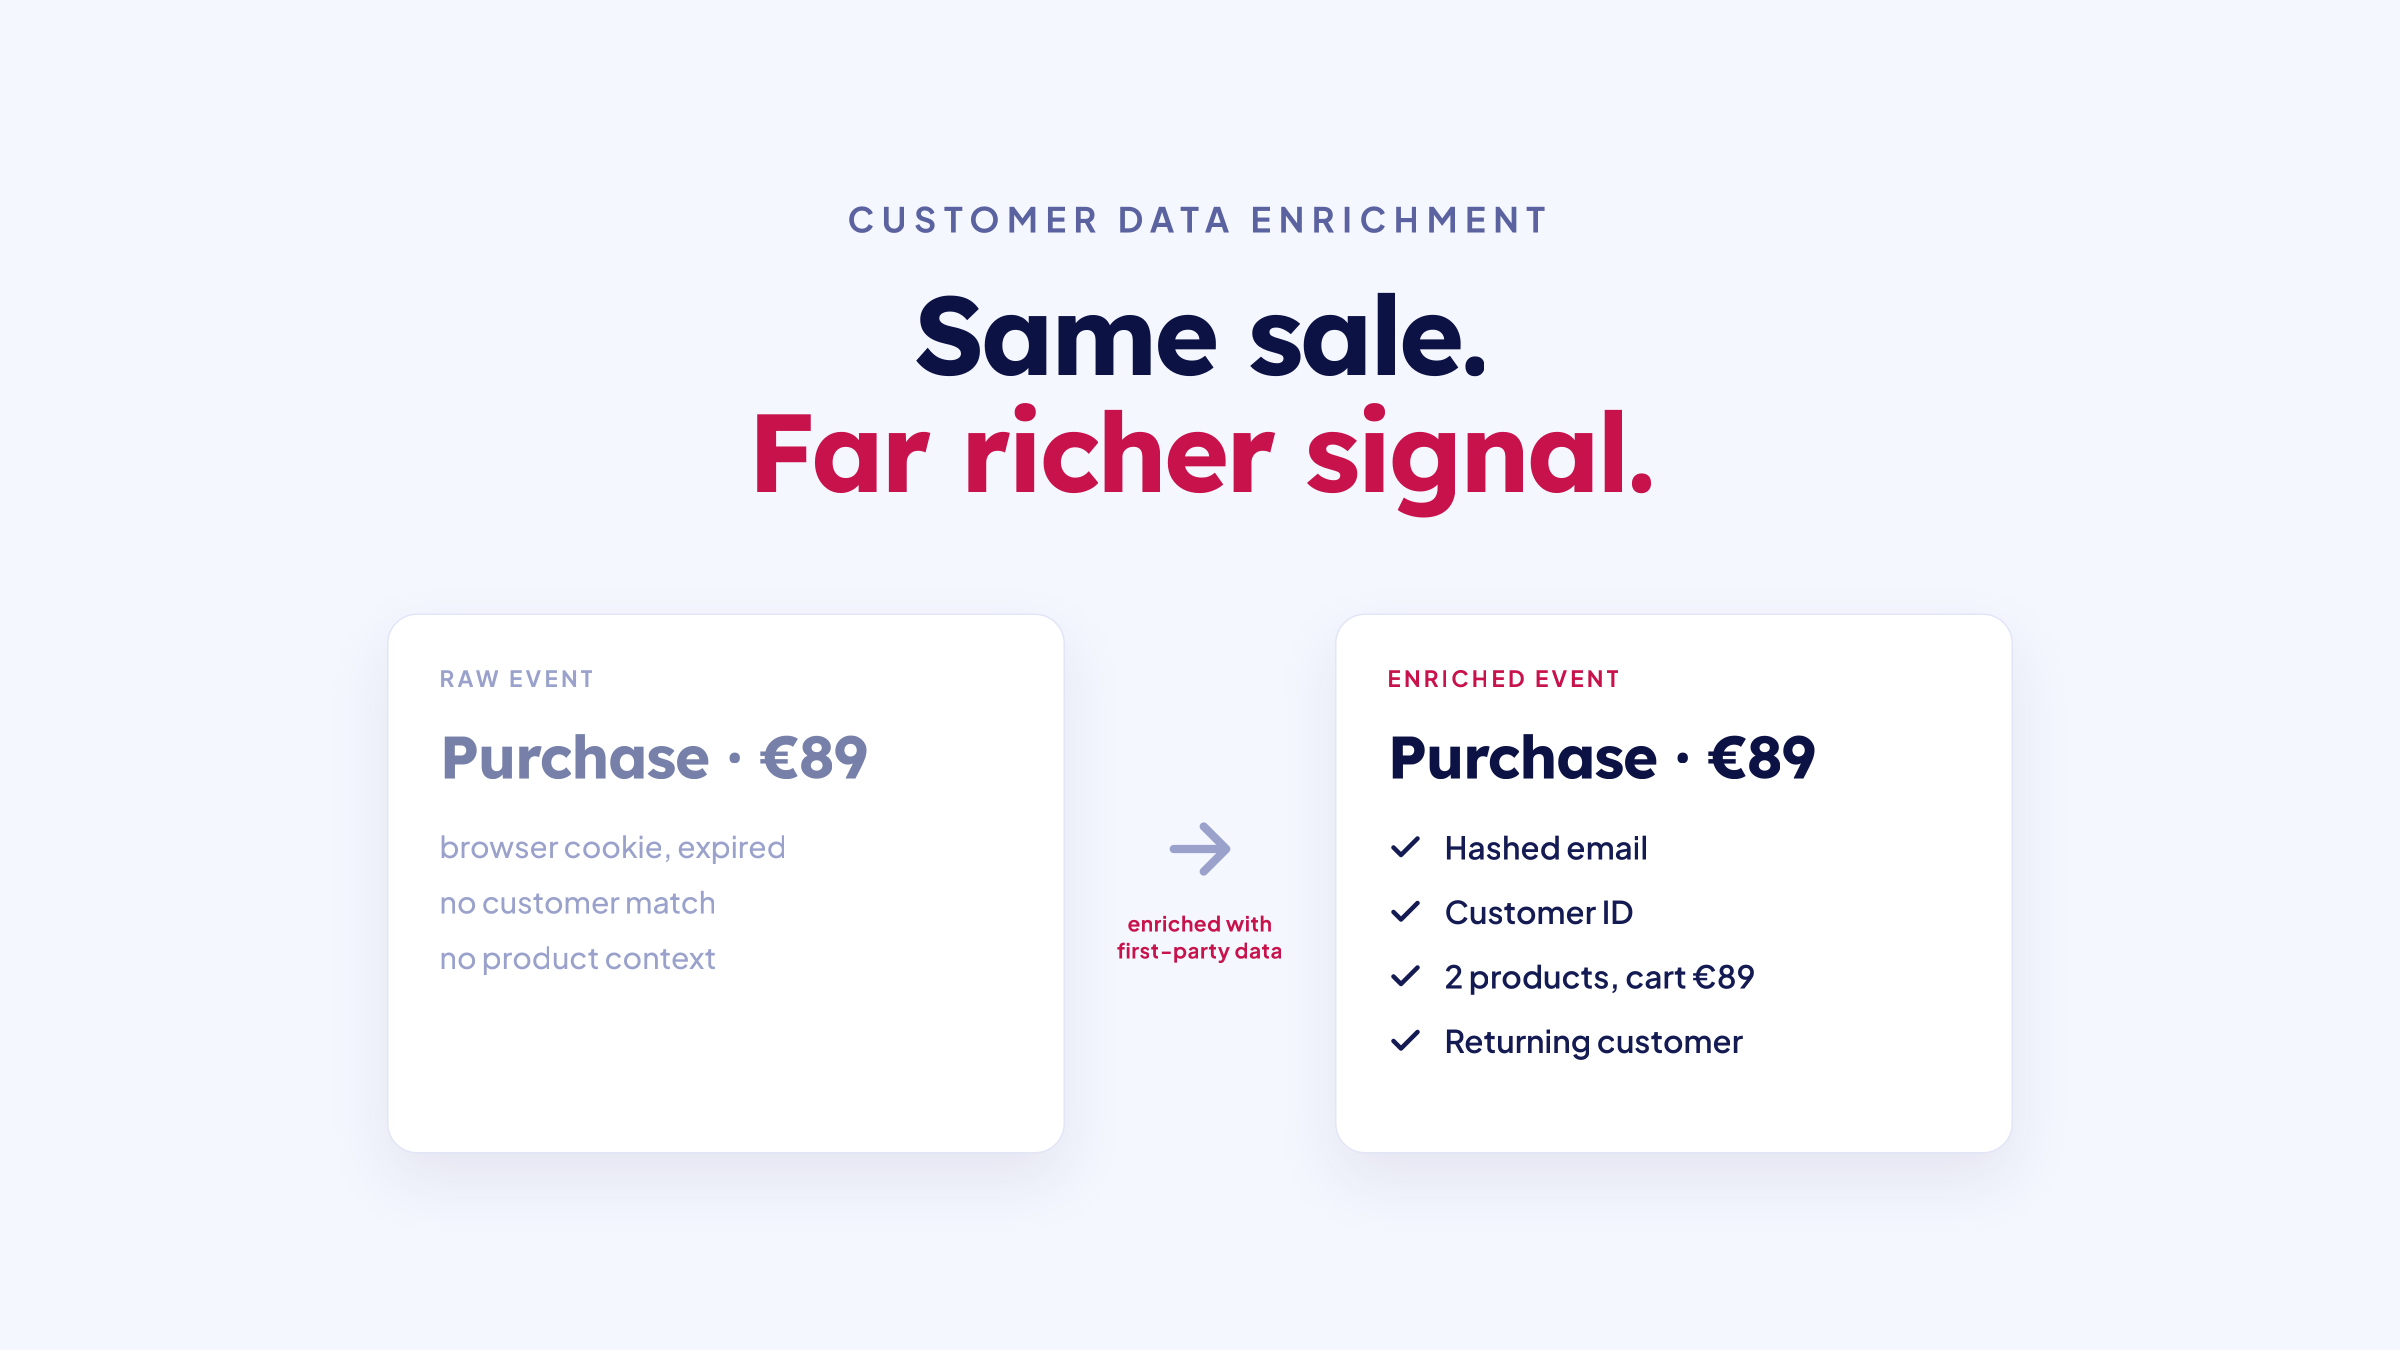
Every call above rests on the ROAS being real. TrackBee is server-side tracking for Shopify that sets up in minutes, no developer project required. It captures the conversions browser pixels miss, enriches it with first-party data, deduplicates events so nothing double-counts, and sends clean signals to Meta, Google, TikTok, Pinterest, and Klaviyo.
That clean foundation is what lets Insights sort your campaigns on sales that actually happened, so you scale the real winners and cut the real losers, instead of chasing whichever numbers the pixel happened to catch. The weekly call is only as honest as the data under it.
Frequently asked questions
When should I scale a Shopify ad? When its ROAS is comfortably above your break-even, the trend is stable or rising, frequency is still low, and it is reaching new people. Scale in steps of 20 to 30 percent so you do not reset the learning phase, and check that the ROAS reflects real, server-side sales first.
When should I cut an ad? When it has had a fair run on enough spend and still sits below break-even with a flat or falling trend. Before cutting, rule out under-reporting, since browser pixels miss roughly 30 to 60 percent of conversions and can make a real winner look like a loser.
What does "watch" mean? It is the honest bucket for campaigns you cannot call yet: near break-even, recently changed and still learning, or sending mixed signals. Leave them alone and reassess next week rather than acting on noise.
How much should I increase budget when scaling? Move in steps of about 20 to 30 percent at a time. A large jump can reset the algorithm's learning and hurt the performance you were trying to grow.
How do I decide scale, cut, or watch across a whole account fast? Ask TrackBee Insights the /analyze-ad-performance prompt in Claude or ChatGPT. It scores every campaign on Meta and Google against your break-even, on real server-side data, and returns a scale, cut, or watch verdict for each.
→ Try TrackBee Insights free and get your weekly scale, cut, or watch calls in one prompt. Or book a free demo and we will run it on your account together.
Read next: Which countries are your Meta ads actually profitable in? | Is your Meta ad fatigued, or is it a tracking gap?


.png)