Which countries are your Meta ads actually profitable in?

Your blended Meta ROAS looks fine, but it is an average, and averages hide the market that is quietly losing money. Here is how to read Meta by country against break-even, and the one question that surfaces the loser.

July 7, 2026
Frank de Vos
A matte clay globe with location pins standing on it, two bright and prominent and a few small and grey, showing that some advertising markets win while others underperform.
Latest
TrackBee Insights

Which countries are your Meta ads actually profitable in?

A matte clay globe with location pins standing on it, two bright and prominent and a few small and grey, showing that some advertising markets win while others underperform.

Short answer: Your blended Meta ROAS is an average, and averages hide the market that is quietly losing money. To see it, split your Meta spend by delivery country and read each market's ROAS against your break-even point, not against the blended number. A country below break-even is losing margin on every euro, even when the account as a whole looks profitable. The fastest way to see it is to ask TrackBee Insights, in plain language, how your Meta campaigns are performing by country.

Say your account runs at a blended 2.8x and you are happy. Underneath that one number, one country might be doing 3.8x while another sits at 1.6x and bleeds budget. The blended figure averages them into something that looks fine, so you keep funding the loser without knowing. This guide shows you how to read Meta by country, where the trap is, and the fast way to see which markets actually deserve your budget.

Do it in one prompt instead

Connect TrackBee Insights to Claude or ChatGPT and ask, in plain language, how each market is doing on your real server-side data:

How are my Meta campaigns performing by country?  Try TrackBee Insights free →

Why blended ROAS hides your worst market

Blended ROAS is total revenue divided by total spend across every country you run in. It is useful for a headline, but it is an average, and an average can look healthy while one part of it is sick.

Picture five markets. Four are profitable and one is well below break-even. The four winners pull the blended number up high enough that the loser disappears into it. You see 2.8x, you see profit, and you never notice that one market is handing back margin on every sale. The only way to catch it is to stop looking at the account as one number and look at it market by market.

Read each country against break-even, not against each other

The mistake is comparing countries to your blended ROAS. The right yardstick is your break-even ROAS: the point where the revenue from an ad just covers the cost of the product and the ad. A rough version is 1 divided by your gross margin. At a 55 percent margin, break-even is around 1.8x. Below that line you lose money, above it you make money, whatever the blended number says.

Read per marketLooks healthyWorth a closer look
ROAS versus your break-evenAt or above break-evenBelow break-even, losing margin on every sale
Share of spendConcentrated in profitable marketsLarge spend sitting in a below-break-even market
CPM and CTR togetherIn line with the marketHighest CPM and lowest CTR at once, a weak fit
Efficiency versus sizeA small market with strong ROAS has room to growA big market with weak ROAS is the one to fix first

Read each row per country, and the picture stops being one blended average and becomes a map of where your money actually works. A small market at 3.8x is a growth opportunity. A large market below break-even is a leak.

The manual way, and why it is slow

You can do this in Meta Ads Manager. Add a breakdown by delivery country, pull spend, revenue, ROAS, CPM, CTR, and frequency per market, then export it and work out your break-even in a spreadsheet so you can mark each country above or below the line.

It works, but it is a manual export every time, it only shows Meta, and it uses whatever conversions the pixel caught, which brings us to the catch most country reports miss.

The catch: single-country ROAS is only directional

Two things make a raw per-country ROAS softer than it looks. First, shoppers cross borders: someone sees the ad while travelling, or buys on a different device in a different place, so the country the platform assigns is not always where the sale really belongs. Second, and bigger, the platform only counts the conversions its pixel caught, and browser pixels miss a large share of sales, commonly estimated at 30 to 60 percent. Between ad blockers (around 30 percent of internet users run one, GWI via DataReportal), iOS privacy (only about half of users opt in to tracking, AppsFlyer), and consent banners, a market can look worse than it is simply because more of its sales went uncounted.

So a raw country ROAS is directional, not gospel. Before you cut a market, make sure the number reflects real sales. If you have not confirmed your tracking, start with how to check if your Shopify conversion tracking is working. On server-side, first-party data, the per-country picture is far closer to the truth.

The one-line version: ask TrackBee Insights

Instead of exporting and reconciling, you can ask for the whole per-country read in plain language. TrackBee Insights connects your TrackBee data to Claude or ChatGPT, and because the question is natural language, there is no slash command to remember:

How are my Meta campaigns performing by country?
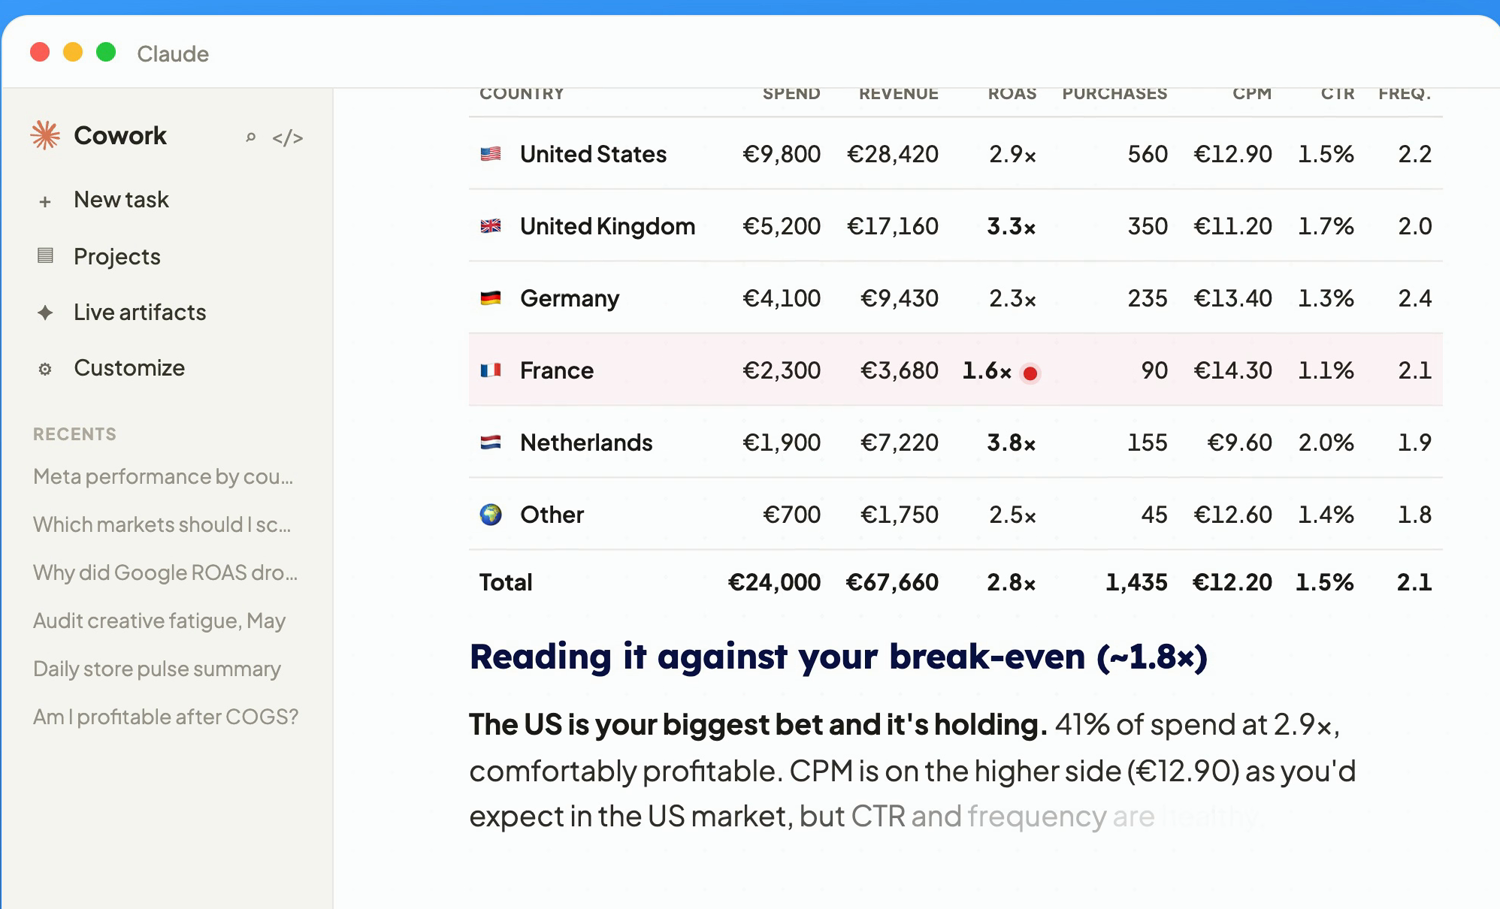
TrackBee Insights answering how Meta campaigns perform by country: a table of spend, revenue, ROAS, purchases, CPM, CTR and frequency per market, with France flagged below break-even, read against a break-even of about 1.8x.

It splits your Meta spend by market, shows spend, revenue, ROAS, purchases, CPM, CTR, and frequency side by side, and then reads it against your break-even. In the example above the account blends to 2.8x, but the United Kingdom is the most efficient large market while France sits at 1.6x, below the roughly 1.8x break-even, losing margin on every euro. The blended number hid both. It even points to where the France budget would work harder instead. Ask it whenever you plan budget, and you fund the markets that earn it.

What to do with a losing market

Once you know which market is below break-even, you have two honest choices:

  • Fix it. Localise the creative and offer, tighten the targeting, and check shipping and pricing for that country. A weak CTR often means the ad simply does not fit the market yet.

  • Reallocate it. If the market has had a fair run and still loses money, move that budget to the markets already clearing break-even with headroom. Your winners can almost always absorb more before they saturate.

  • Grow your efficient small markets. A country doing 3.8x on a small budget is often your best next bet, as long as the audience is big enough to scale into.

Judge markets against real sales, not the pixel

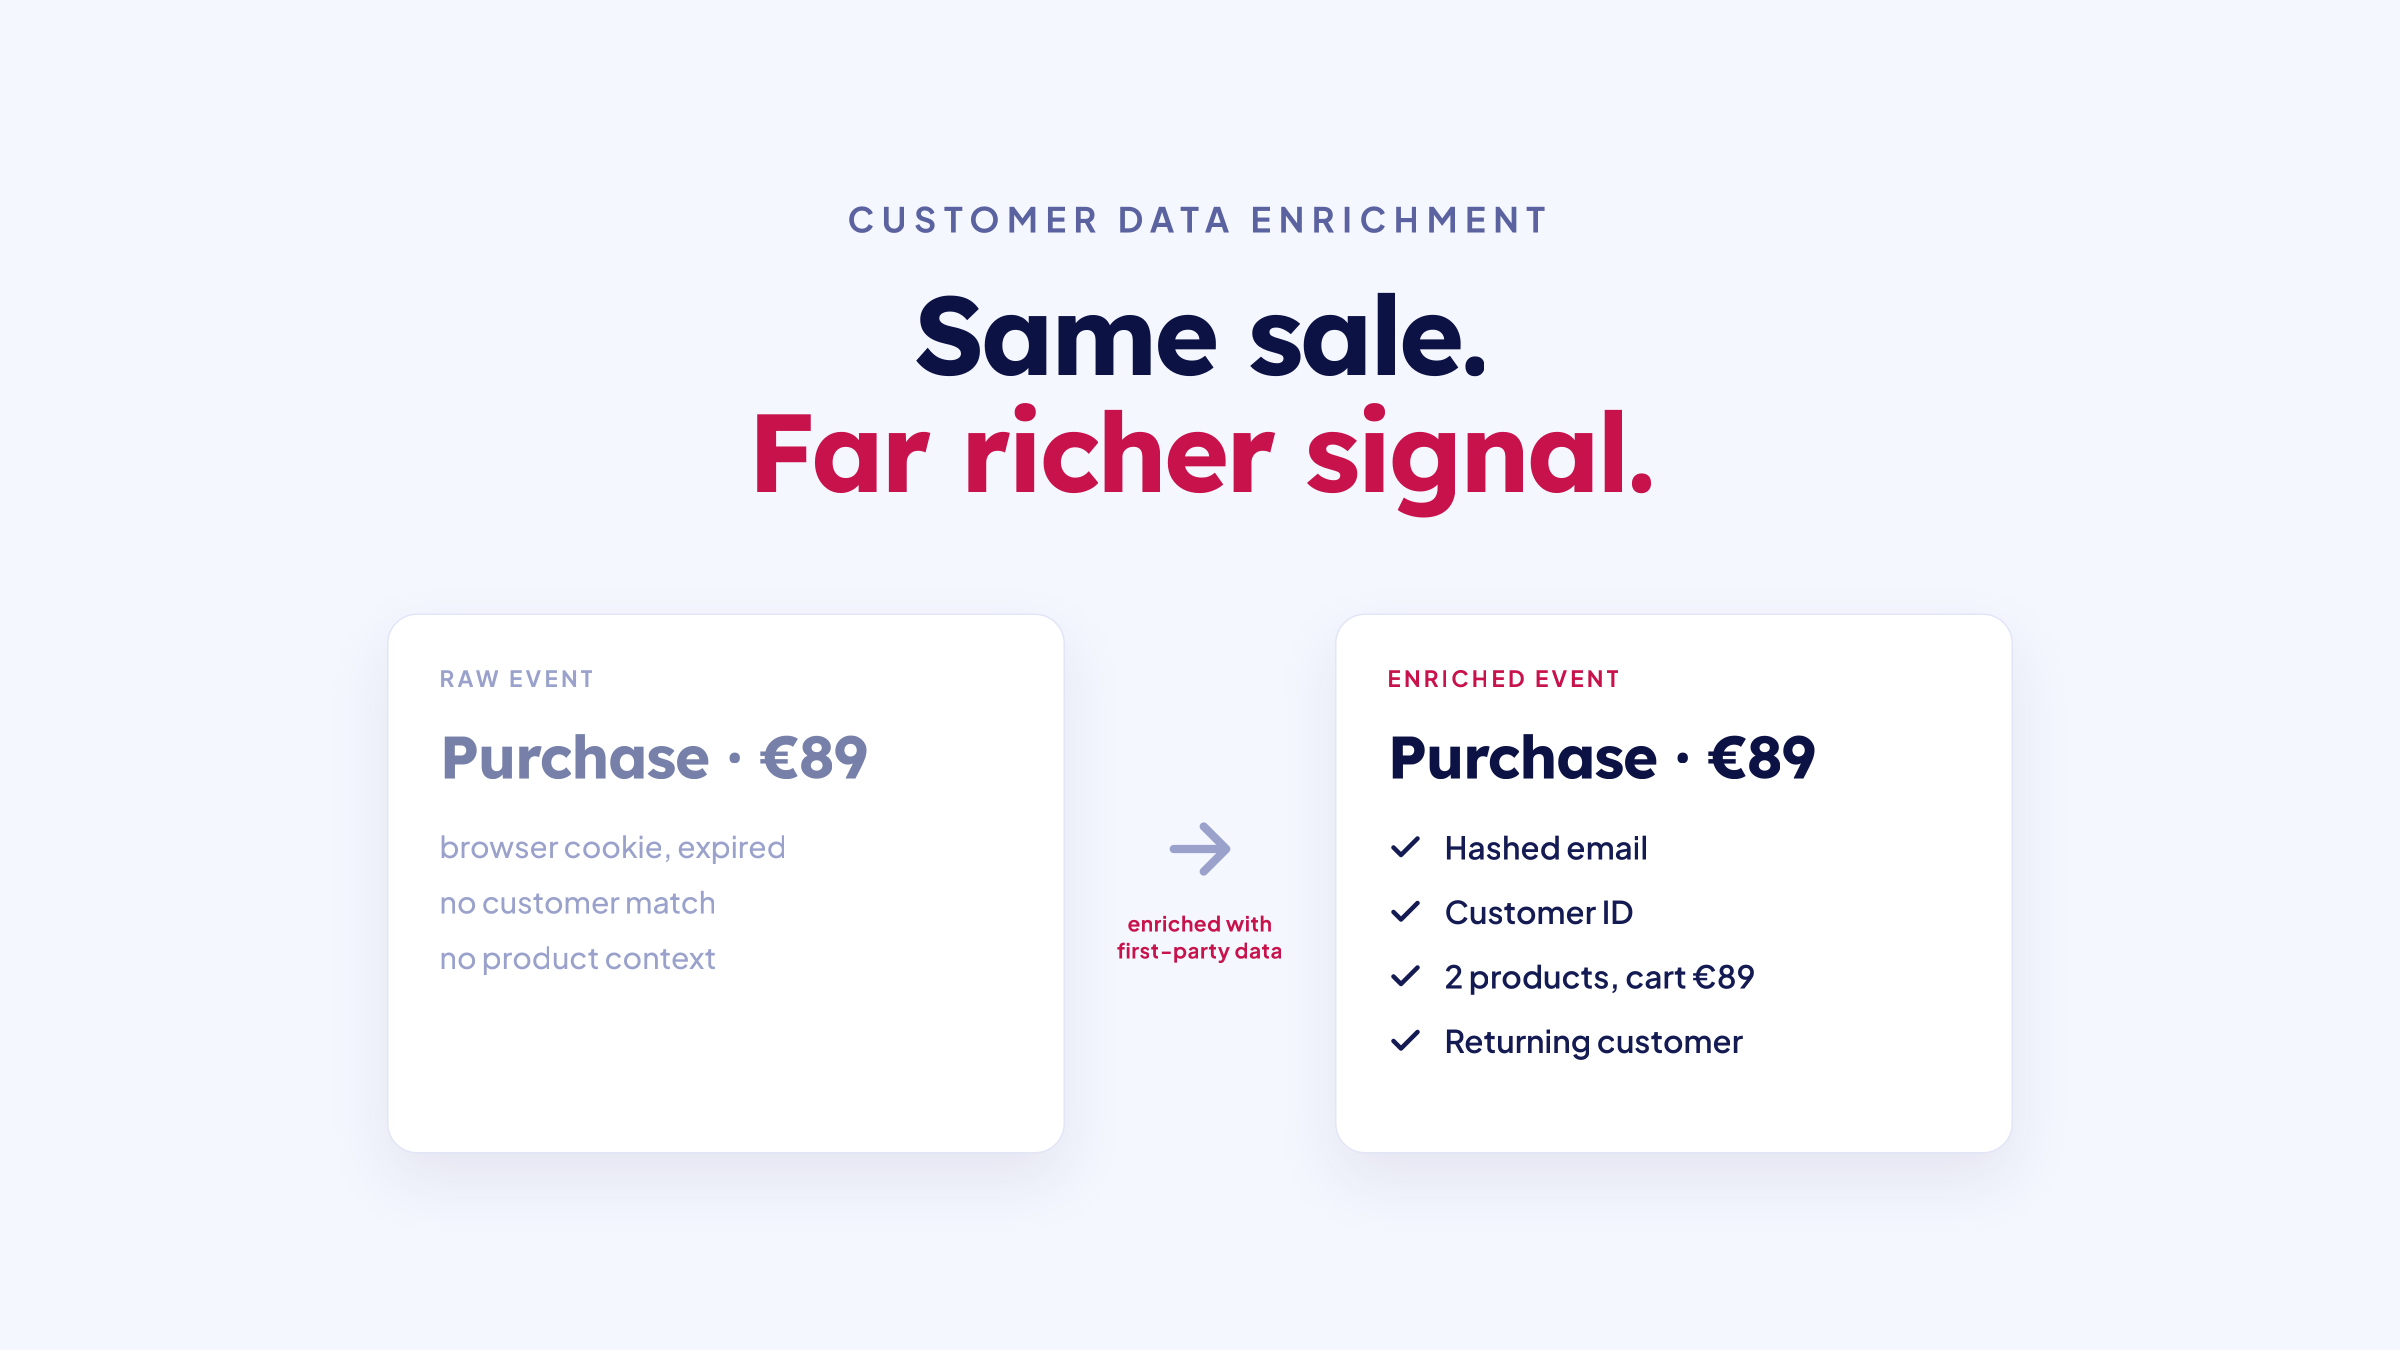
Every call above rests on the per-country number being real. TrackBee is server-side tracking for Shopify that sets up in minutes, no developer project required. It captures the conversions browser pixels miss, enriches it with first-party data, deduplicates events so nothing double-counts, and sends clean signals to Meta, Google, TikTok, Pinterest, and Klaviyo.

That clean foundation is what lets Insights read each market on sales that actually happened, so a country does not get cut for looking weak when it was only under-counted. The per-country read is only as honest as the tracking underneath it.

Frequently asked questions

Why is my blended ROAS good but some countries lose money? Blended ROAS is an average across all markets. Profitable countries can pull the number up high enough to hide one that is below break-even. Splitting spend by country and reading each against break-even is the only way to see the loser.

What is a good ROAS by country? There is no single number. The one that matters is your break-even ROAS, roughly 1 divided by your gross margin, so at a 55 percent margin it is about 1.8x. Any market above that line makes money and any market below it loses money, regardless of the blended figure.

Should I turn off a country that is below break-even? Not automatically. First confirm the number reflects real sales, since pixel loss and cross-border journeys can understate a market. Then either localise the creative and targeting, or reallocate the budget to markets already clearing break-even.

Can I trust Meta's per-country numbers? Treat them as directional. Browser pixels miss roughly 30 to 60 percent of conversions, and shoppers cross borders and devices, so single-country ROAS is softer than it looks. Server-side, first-party data gives a per-country read much closer to the truth.

How do I see Meta performance by country without exporting reports? Ask TrackBee Insights in Claude or ChatGPT how your Meta campaigns are performing by country. It returns the per-market table and reads it against your break-even, using your real server-side data.

→ Try TrackBee Insights free and see your Meta performance by country in one question. Or book a free demo and we will look at your markets together.

Read next: Audience saturation on Meta ads: how to spot it before your ROAS crashes | How to find exactly where your Shopify funnel is leaking

In this article
Boost Your Revenue
Track Missing Conversion Data
Lorem Ipsum

Boost Your Revenue

Track & Enrich
Missing Conversion Data

Try for free
Share this:

Short answer: Your blended Meta ROAS is an average, and averages hide the market that is quietly losing money. To see it, split your Meta spend by delivery country and read each market's ROAS against your break-even point, not against the blended number. A country below break-even is losing margin on every euro, even when the account as a whole looks profitable. The fastest way to see it is to ask TrackBee Insights, in plain language, how your Meta campaigns are performing by country.

Say your account runs at a blended 2.8x and you are happy. Underneath that one number, one country might be doing 3.8x while another sits at 1.6x and bleeds budget. The blended figure averages them into something that looks fine, so you keep funding the loser without knowing. This guide shows you how to read Meta by country, where the trap is, and the fast way to see which markets actually deserve your budget.

Do it in one prompt instead

Connect TrackBee Insights to Claude or ChatGPT and ask, in plain language, how each market is doing on your real server-side data:

How are my Meta campaigns performing by country?  Try TrackBee Insights free →

Why blended ROAS hides your worst market

Blended ROAS is total revenue divided by total spend across every country you run in. It is useful for a headline, but it is an average, and an average can look healthy while one part of it is sick.

Picture five markets. Four are profitable and one is well below break-even. The four winners pull the blended number up high enough that the loser disappears into it. You see 2.8x, you see profit, and you never notice that one market is handing back margin on every sale. The only way to catch it is to stop looking at the account as one number and look at it market by market.

Read each country against break-even, not against each other

The mistake is comparing countries to your blended ROAS. The right yardstick is your break-even ROAS: the point where the revenue from an ad just covers the cost of the product and the ad. A rough version is 1 divided by your gross margin. At a 55 percent margin, break-even is around 1.8x. Below that line you lose money, above it you make money, whatever the blended number says.

Read per marketLooks healthyWorth a closer look
ROAS versus your break-evenAt or above break-evenBelow break-even, losing margin on every sale
Share of spendConcentrated in profitable marketsLarge spend sitting in a below-break-even market
CPM and CTR togetherIn line with the marketHighest CPM and lowest CTR at once, a weak fit
Efficiency versus sizeA small market with strong ROAS has room to growA big market with weak ROAS is the one to fix first

Read each row per country, and the picture stops being one blended average and becomes a map of where your money actually works. A small market at 3.8x is a growth opportunity. A large market below break-even is a leak.

The manual way, and why it is slow

You can do this in Meta Ads Manager. Add a breakdown by delivery country, pull spend, revenue, ROAS, CPM, CTR, and frequency per market, then export it and work out your break-even in a spreadsheet so you can mark each country above or below the line.

It works, but it is a manual export every time, it only shows Meta, and it uses whatever conversions the pixel caught, which brings us to the catch most country reports miss.

The catch: single-country ROAS is only directional

Two things make a raw per-country ROAS softer than it looks. First, shoppers cross borders: someone sees the ad while travelling, or buys on a different device in a different place, so the country the platform assigns is not always where the sale really belongs. Second, and bigger, the platform only counts the conversions its pixel caught, and browser pixels miss a large share of sales, commonly estimated at 30 to 60 percent. Between ad blockers (around 30 percent of internet users run one, GWI via DataReportal), iOS privacy (only about half of users opt in to tracking, AppsFlyer), and consent banners, a market can look worse than it is simply because more of its sales went uncounted.

So a raw country ROAS is directional, not gospel. Before you cut a market, make sure the number reflects real sales. If you have not confirmed your tracking, start with how to check if your Shopify conversion tracking is working. On server-side, first-party data, the per-country picture is far closer to the truth.

The one-line version: ask TrackBee Insights

Instead of exporting and reconciling, you can ask for the whole per-country read in plain language. TrackBee Insights connects your TrackBee data to Claude or ChatGPT, and because the question is natural language, there is no slash command to remember:

How are my Meta campaigns performing by country?
TrackBee Insights answering how Meta campaigns perform by country: a table of spend, revenue, ROAS, purchases, CPM, CTR and frequency per market, with France flagged below break-even, read against a break-even of about 1.8x.

It splits your Meta spend by market, shows spend, revenue, ROAS, purchases, CPM, CTR, and frequency side by side, and then reads it against your break-even. In the example above the account blends to 2.8x, but the United Kingdom is the most efficient large market while France sits at 1.6x, below the roughly 1.8x break-even, losing margin on every euro. The blended number hid both. It even points to where the France budget would work harder instead. Ask it whenever you plan budget, and you fund the markets that earn it.

What to do with a losing market

Once you know which market is below break-even, you have two honest choices:

  • Fix it. Localise the creative and offer, tighten the targeting, and check shipping and pricing for that country. A weak CTR often means the ad simply does not fit the market yet.

  • Reallocate it. If the market has had a fair run and still loses money, move that budget to the markets already clearing break-even with headroom. Your winners can almost always absorb more before they saturate.

  • Grow your efficient small markets. A country doing 3.8x on a small budget is often your best next bet, as long as the audience is big enough to scale into.

Judge markets against real sales, not the pixel

Every call above rests on the per-country number being real. TrackBee is server-side tracking for Shopify that sets up in minutes, no developer project required. It captures the conversions browser pixels miss, enriches it with first-party data, deduplicates events so nothing double-counts, and sends clean signals to Meta, Google, TikTok, Pinterest, and Klaviyo.

That clean foundation is what lets Insights read each market on sales that actually happened, so a country does not get cut for looking weak when it was only under-counted. The per-country read is only as honest as the tracking underneath it.

Frequently asked questions

Why is my blended ROAS good but some countries lose money? Blended ROAS is an average across all markets. Profitable countries can pull the number up high enough to hide one that is below break-even. Splitting spend by country and reading each against break-even is the only way to see the loser.

What is a good ROAS by country? There is no single number. The one that matters is your break-even ROAS, roughly 1 divided by your gross margin, so at a 55 percent margin it is about 1.8x. Any market above that line makes money and any market below it loses money, regardless of the blended figure.

Should I turn off a country that is below break-even? Not automatically. First confirm the number reflects real sales, since pixel loss and cross-border journeys can understate a market. Then either localise the creative and targeting, or reallocate the budget to markets already clearing break-even.

Can I trust Meta's per-country numbers? Treat them as directional. Browser pixels miss roughly 30 to 60 percent of conversions, and shoppers cross borders and devices, so single-country ROAS is softer than it looks. Server-side, first-party data gives a per-country read much closer to the truth.

How do I see Meta performance by country without exporting reports? Ask TrackBee Insights in Claude or ChatGPT how your Meta campaigns are performing by country. It returns the per-market table and reads it against your break-even, using your real server-side data.

→ Try TrackBee Insights free and see your Meta performance by country in one question. Or book a free demo and we will look at your markets together.

Read next: Audience saturation on Meta ads: how to spot it before your ROAS crashes | How to find exactly where your Shopify funnel is leaking

Latest

Discover other Blogs

Explore our collection of informative and engaging blog posts.

Three chunky clay icons on pedestals: a yellow up arrow for scale, a sky-blue pause for watch, and a navy down arrow for cut, the three weekly calls for an ad campaign.
Frank de Vos
Frank de Vos
7
min read
A stack of ad creative cards in brand colors with the worn, faded, dog-eared card on top, showing one fatigued ad and fresh replacements waiting behind it.
Frank de Vos
Frank de Vos
7
min read
A megaphone points at a crowd of clay figures; the ones nearest are bright and engaged, the ones further back have turned grey and worn out, showing an ad audience becoming saturated.
Frank de Vos
Frank de Vos
7
min read