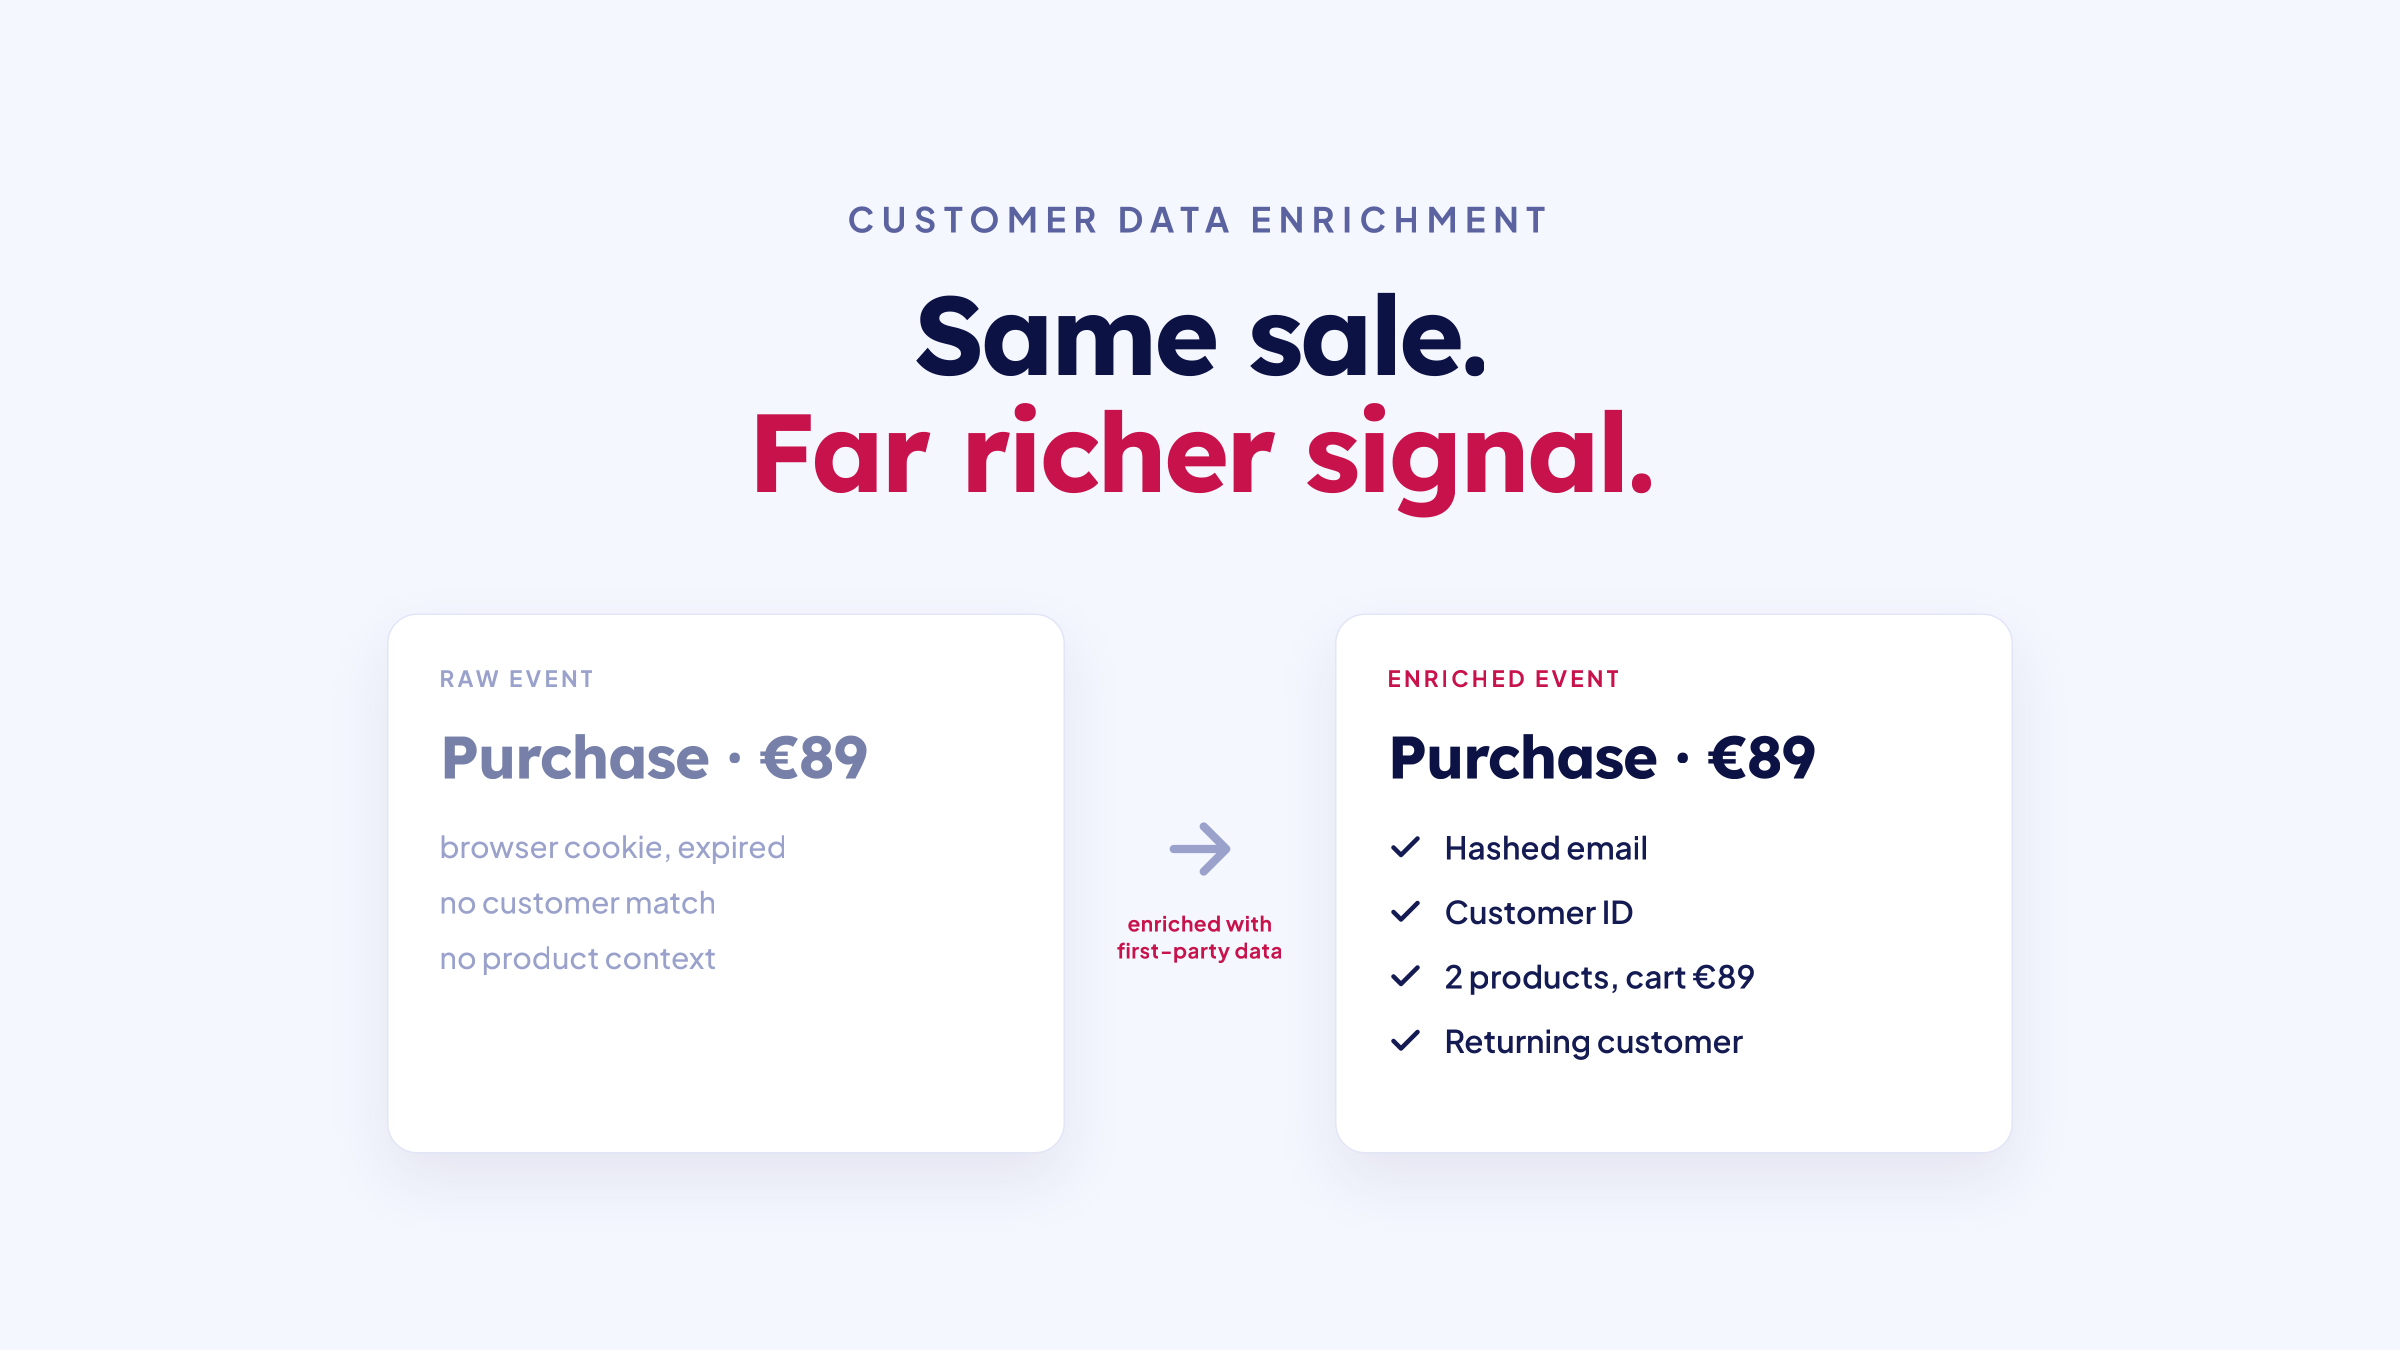


Short answer: Your Shopify funnel is a series of steps: page view, product view, add to cart, checkout started, and order. To find the leak, look at the conversion rate between each step. The step with the steepest drop is where you lose the most customers, and it is the highest-leverage place to fix. The fastest way to see it is to ask TrackBee Insights the /store-funnel prompt, which returns every stage, its conversion rate, and names your biggest leak in one answer.
You know sales could be higher. Traffic looks fine, ads are running, but the orders do not follow. Somewhere between the first page view and the thank-you page, people are quietly dropping off. The question is where, and most stores never pin it down because the answer is spread across four different tools.
This guide shows you the five stages of a Shopify funnel, how to read the drop-off at each one, and the fast way to find your biggest leak without opening five reports.
Do it in one prompt instead
Connect TrackBee Insights to Claude or ChatGPT and find exactly where your funnel is leaking, on your real server-side data:
/store-funnel Try TrackBee Insights free →
The five stages of a Shopify funnel
Almost every Shopify store has the same core funnel. Each step is a smaller group of people than the one before it:
Page view. Someone lands on your store. This is the top of the funnel.
Product view. They look at an actual product, not just the homepage.
Add to cart. They put something in the cart.
Checkout started. They begin checkout.
Order. They pay. This is the only step that makes you money.
Your job is not to fix every step. It is to find the one step where the biggest share of people fall away, because fixing that single step moves more revenue than anything else you could do that week.
Find your biggest leak
Look at the conversion rate between each pair of steps, not the overall number. The lowest step-to-step rate is your steepest leak. Here is how to read each one.
| Funnel step | Roughly healthy | A weak rate usually points to |
|---|---|---|
| Page view to product view | 40 to 60% | Slow load, weak merchandising, or ads that do not match the landing page |
| Product view to add to cart | Often the steepest single drop | Product page: unclear price or value, weak imagery, missing reviews, unclear shipping or stock, slow mobile |
| Add to cart to checkout started | 45 to 65% | Price shock once shipping shows, or shoppers parking items to decide later |
| Checkout started to order | About 45% on average, 50 to 70% for strong stores | Checkout friction: forced account, few payment options, surprise costs |
| Page view to order (overall) | Around 2% on average, above 3% is strong | Read the steps above to see which one is dragging it down |
Treat these as rough guides, not hard rules. Every store is different, and the number that matters most is your own trend over time. The real signal is the steepest drop between two steps, because that is where the most people leave at once. For context, the average online store converts around 2 percent of sessions into orders (IRP Commerce), and across ecommerce only about 6 percent of product-page views become an add to cart (Dynamic Yield), which is why the product page is so often the steepest drop.
The manual way, and why it is slow
You can build this by hand. In Shopify admin, open Analytics, then Reports, then the online store conversion over time and the conversion funnel reports. Note the rate at each step. Then open GA4 to sanity-check the numbers, open a session-recording tool to watch where people hesitate, and drop it all into a spreadsheet to compare against last month.
It works, but it is slow, and you end up doing it across four tools that each count slightly differently. By the time you have a clear picture, the week is gone. Worse, one of those tools is probably lying to you, which brings us to the part most funnel guides skip.
A leak can be a tracking problem, not a real one
Before you rebuild a product page or a checkout, make sure the drop you are seeing is real. A funnel is only as honest as the tracking underneath it, and the browser pixel that most Shopify stores rely on misses a large share of conversions, commonly estimated at 30 to 60 percent. The causes stack up: around 30 percent of internet users run an ad blocker (GWI via DataReportal), only about half of iOS users opt in to tracking (AppsFlyer), and consent banners and cross-device journeys break the rest.
The checkout and purchase steps are the ones most often under-counted, because they happen last, when the shopper is most likely to have a blocker on or to have bounced between devices. So a checkout that looks broken in your analytics can actually be a checkout that works fine and simply is not being fully tracked. If you have not confirmed your tracking yet, start with our guide on how to check if your Shopify conversion tracking is working. Fix the measurement first, then trust the funnel.
This is why server-side tracking matters for funnel analysis. When events are captured on the server instead of the browser, the later steps stop leaking data, and the drop-off you see is real behaviour rather than a measurement gap.
The one-line version: ask TrackBee Insights
Instead of stitching four tools together, you can ask for the whole funnel in one question. TrackBee Insights connects your TrackBee data to Claude or ChatGPT, so you ask in plain language and get an answer built on your real, server-side data. To find your leak, you type one prompt:
/store-funnelIt leads with the answer, the single step where you lose the most shoppers, then lays out the full funnel with the conversion rate at every stage and reads it back in plain language.
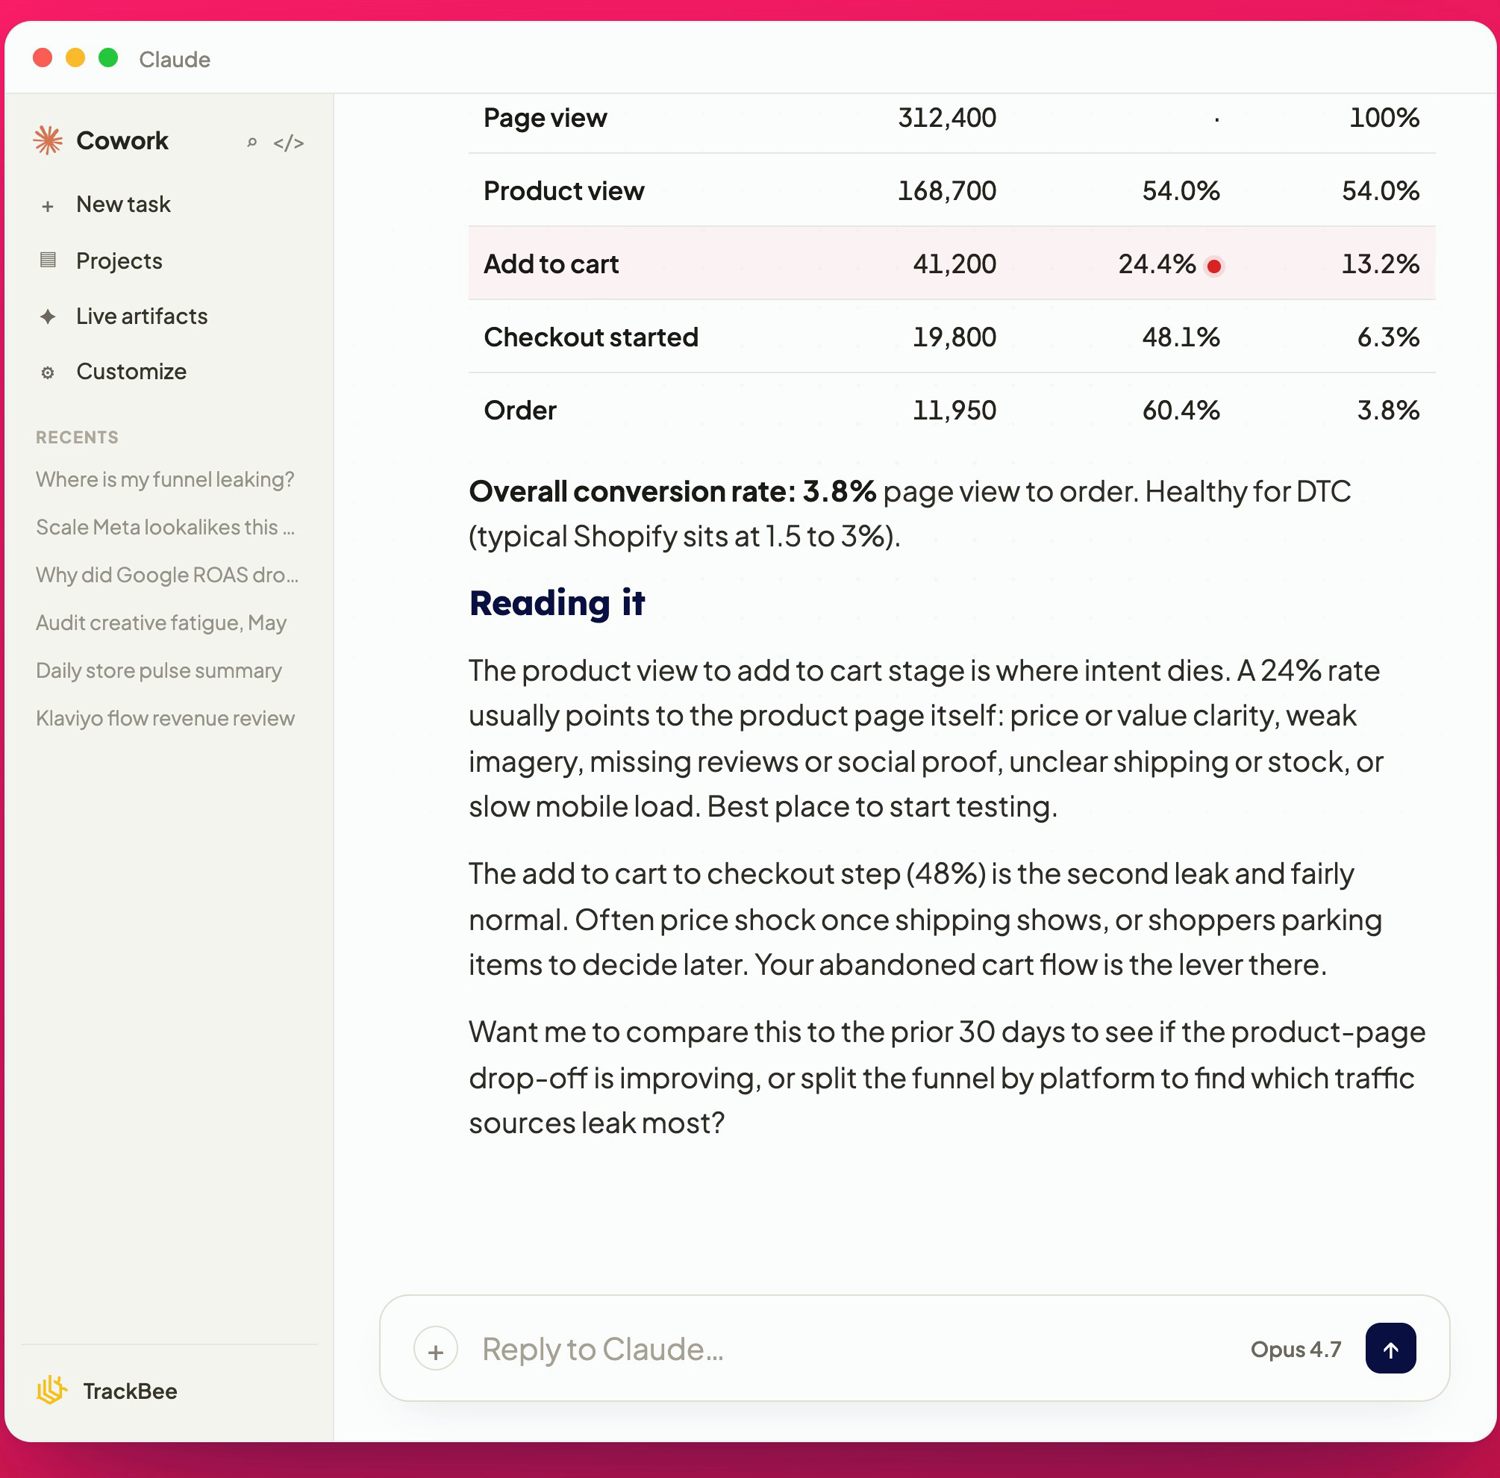
In this example the store looks healthy overall, with a 3.8 percent page-view-to-order rate comfortably above what most Shopify stores manage, where the average sits around 2 percent. But the product view to add to cart step is where intent dies: only 24 percent of people who view a product add it to the cart. That one step is the highest-leverage place to test, and Insights points straight at it, then explains the likely causes and what to look at next. Ask it once a month, or after any store change, so a new leak never runs for weeks before you notice.
What to do about each leak
Once you know your steepest drop, the fix follows the stage:
Page view to product view. Speed up your store, tighten the match between your ads and the page they land on, and make your best products easier to reach.
Product view to add to cart. This is usually the product page. Clarify price and value, add strong imagery and reviews, show shipping and stock clearly, and check mobile load time.
Add to cart to checkout started. Roughly 70 percent of carts are abandoned on average (Baymard Institute), so show shipping costs earlier to cut the surprise, and lean on your abandoned-cart flow in Klaviyo to bring parked shoppers back.
Checkout started to order. Remove friction: allow guest checkout, offer more payment options, and cut any surprise costs at the final step.
How server-side tracking makes your funnel numbers trustworthy
A funnel is a decision tool, and a decision is only as good as the data under it. TrackBee is server-side tracking for Shopify that sets up in minutes, no developer project required. It captures the conversions browser pixels miss, enriches it with first-party data, deduplicates events so nothing double-counts, and sends clean signals to Meta, Google, TikTok, Pinterest, and Klaviyo.
That clean foundation is what makes the funnel worth reading. Insights is the layer on top that turns it into a plain-language answer. The tracking is what makes that answer true.
Frequently asked questions
What is a good conversion rate for a Shopify store? The average online store converts around 2 percent of sessions into orders, and clearing 3 percent is strong for direct-to-consumer. The overall number hides where the problem is, though, so always read the step-to-step rates to find the actual leak.
Where do most Shopify stores lose customers? The two most common leaks are product view to add to cart (a product-page problem) and add to cart to checkout (price shock or parked carts). The steepest drop in your own funnel is the one to fix first.
Why does my Shopify funnel show more drop-off than seems real? Often it is a tracking gap, not real behaviour. Browser pixels miss roughly 30 to 60 percent of conversions, and the checkout and purchase steps are hit hardest. Confirm your tracking first, ideally with server-side tracking, so the funnel reflects real shoppers.
How do I see my whole funnel without building reports? Ask TrackBee Insights the /store-funnel prompt in Claude or ChatGPT. It returns every stage, the conversion rate at each one, and names your biggest leak, using your real server-side data.
How often should I check my funnel? Once a month is a good baseline, plus any time you change your theme, product pages, or checkout. Comparing against your own trend is more useful than any single benchmark.
→ Try TrackBee Insights free and ask where your funnel is leaking in one prompt. Or book a free demo and we will walk your funnel with you.
Read next: How to check if your Shopify conversion tracking is working | Why Meta conversions don't match Shopify orders


.png)